
|
Open Access Repositorium für Messinstrumente |
Cross-Cultural Loss Scale (CCLS)
- Messinstrument
- Dokumentation
- Zitieren
- Nutzungsbedingungen
- Standardlizenz
- Zur Nutzung für andere Zwecke
kontaktieren Sie die Autor*innen
Instruction
People experience losses when they are in a different country, such as access to food from back home, the ability to handle daily tasks in the new environment, and a sense of connectedness with others. Please rate the level each item below describes your situation based on comparing your experiences back in your home country with now living in this new country.
“Compared with your experiences back in your home country, NOW living in this new country you . . .”
Items
Table 1
Items of the scale
|
No. |
Item |
Subscale |
|
1 |
have less in-person access to family members in your home country |
AHF |
|
2 |
have less access to welfare (e.g., health care, benefits) for citizens |
NP |
|
3 |
experience more restrictions as a foreigner |
NP |
|
4 |
have fewer opportunities for intimate relationships |
BC |
|
5 |
have less knowledge of the resources available in your environment |
BC |
|
6 |
have a more difficult time fitting in with others |
BC |
|
7 |
have less access to the cultural environment of home |
AHF |
|
8 |
have less access to entertainment from your home country |
AHF |
|
9 |
have less access to food from your country |
AHF |
|
10 |
sense a loss of civil rights (e.g., employment, vote) |
NP |
|
11 |
feel less connected to others around you |
BC |
|
12 |
are less certain about how to behave appropriately in daily life |
BC |
|
13 |
have to deal with additional requirements to stay in this new country |
NP |
|
14 |
feel less engaged to daily topics in your surrounding |
BC |
|
Note: BC = Belonging-Competency; AHF = Access to Home Familiarity, NP = National Privileges |
||
Response specifications
Each of the 14 items was presented with the five response categories “not at all,” “slightly,” “moderately,” “strongly,” and “completely.”
Scoring
All items are answered on a five-point scale ranging from 1 = not at all to 5 = completely. All items are worded in the same direction. A scale score for each subscale and the total score can be computed as the unweighted sum of the items corresponding to each (sub-) scale. Thereby, higher scores indicate greater cross-cultural loss.
Application field
The CCLS addresses the common tangible and intangible losses applicable for most sojourner and immigrant groups, including international students. The CCLS is developed for individuals who are currently not living in their country of origin (e.g., international students, immigrants, sojourners, missionaries). This scale can be administered in various forms (paper-pencil, written online mode, oral questioning, etc.)
People experience losses when they are in a different country, such as access to food from back home, the ability to handle daily tasks in the new environment, and a sense of connectedness with others. Given the emerging evidence for acculturative stress and loss associated with international students, international workers, immigrants, and refugees, developing a reliable and valid instrument that measures cross-cultural loss would likely advance the literature in this area. In addition, the rapidly increasing global interactions have made crossing national borders and living in a different country a more common experience for people around the world. Thus, the concept of cross-cultural loss should receive more attention. The lack of studies on cross-cultural loss with international students is mainly due to the absence of an appropriate measure of this construct for this population. Thus, the main purpose of this study is to develop a cross-cultural loss scale that addresses the common losses applicable for most sojourner and immigrant groups, including international students when crossing national borders.
Initially, our research team identified seven domains of losses that are associated with crossing national borders through reviewing the literature, brainstorming, and informal interviews with sojourners. These domains were: communication (Ward, Bochner, & Furnham, 2001), tangible access (Gilbert, 2008; Sawir, Marginson, Deumert, Nyland, & Ramia, 2008), belongingness, self-efficacy, relevant knowledge, national privilege, and national identity (e.g., Eisenbruch, 1990; Gilbert, 2008). Through the process of item development, refinement, and additional consolidation with theoretical considerations, we reduced these domains to four major types. First, accessibility to aspects of the home country, including people, places, food, music, climate, and network have been addressed by several scholars (e.g., Aroian, Norris, Tran, & Schappler-Morris, 1998; Rakhsha, 2002; Vromans, Schweitzer, & Brough, 2012) and have been contrasted with other intangible losses experienced in the host country. Second, as for intangible losses, Rakhsha (2002) highlighted three types: effortless sense of belonging, relevancy of knowledge, and self-efficacy. The loss of effortless sense of belonging occurs when missing the repertoire of daily subconscious processes one once had in one’s home country. The knowledge accumulated from experiences in one’s country of origin often do not apply in the new country and can make managing tasks and social interaction much more challenging, which in turn results in a loss of self-efficacy. Due to much overlap between relevancy of knowledge and self-efficacy, we combined them into competency, which leaves us with two main categories—belongingness and competency— which were also addressed by other scholars (e.g., Casado, Hong, & Harrington, 2010; Ding et al., 2011; Vinokurov, Trickett, & Birman, 2002; Vromans et al., 2012). Finally, we added a loss specifically related to rights and privileges that come with having citizenship of the residing country. This loss may be most applicable for international students, recent immigrants and refugees as well as temporary foreigners, who are only in the new country for a limited period of time. As a result, we consider the construct of cross-cultural loss to comprise four subdomains, namely Access to Home Familiarity, Belongingness, Competency, and National Privileges. Belongingness was defined as the sense of belongingness and social connection in host country; Competency was defined as communication skills, relevant knowledge, and sense of efficacy in the host country; Access to Home Familiarity was defined as the accessibility of aspects (e.g., environment, people, things, and culture) of home country; and National Privileges was defined as privileges associated with being a national citizen or permanent resident within a country. After analyzing the data, we found that only three of these four dimensions were empirically distinguished, which resulted in combining belongingness and competency for our final measure.
tem generation and selection
Initial development. A team of five advanced graduate students and one professor in counseling psychology with experience, knowledge, and expertise in cross-cultural psychology generated initial scale items based on research on grief and loss associated with international students, immigrants, and people with cross-cultural experiences. The team generated a total of 126 items based on these seven domains: communication (Ward et al., 2001), tangible access (Gilbert, 2008; Sawir et al., 2008), belongingness, self-efficacy, relevant knowledge, national privilege, and national identity (e.g., Eisenbruch, 1990; Gilbert, 2008). Sample items include: “I find it difficult to articulate my thoughts” (communication), “I miss my family” (tangible access), “I feel isolated” (belongingness), “I struggle to perform well” (self-efficacy), “I don't know how the system works here” (relevant knowledge), “I face extra challenges in being a foreigner” (national privileges), and “I have lost a sense of cultural identity” (national identity). These items were then reviewed to ensure that they were clear, concise, readable, distinct, and reflect the scale’s purpose as suggested by Worthington and Whittaker (2006). After the items were reviewed, 60 items were left in the initial item pool after removing items that were redundant, unclear, and irrelevant.
Existing scale review and individual interviews. Items in established measures related to acculturative stress, cultural adaption, and general loss were then reviewed to include additional items related to each domain (e.g., Sandhu & Asrabadi, 1994; Vinokurov et al., 2002). In addition, individual interviews were conducted with seven interviewees (three women, four men; originally from China, Taiwan, South Korea, Ghana, and Kenya) who were studying or working in the U.S., and seven students from the U.S. (six women, one man), who previously had short-term or long-term study or work abroad experiences (countries they stayed were Paraguay, Dominican Republic, Guinea, Japan, and China). We asked them about the losses they experienced and things they missed during their stay in another country. Existing items were revised and new items added based on input from the interviews. The research team went through a few rounds of classifying and revising items for clarity, which resulted in a total of 58 items after adding a few new items and removing items that were less relevant.
Expert Review. To evaluate the items’ quality and representativeness of the construct, three graduate students and two professional experts in cross-cultural psychology and scale construction were asked to categorize the items into domains and to determine the extent to which the pool of 58 items: (a) reflected the definition of cross-cultural loss (relevancy), and (b) were clearly and simply written (clarity). The experts were also instructed to freely edit any of the items, suggest new items, and provide any additional feedback to improve the scale. During the first round of expert feedback, we received input from one expert about the overlap between domains and unclear items. Based on the expert’s feedback, we re-examined and modified items, and also reduced the number of domains from seven to four, which are belongingness, competency, access to home familiarity, and national privileges. To aid in assessing content validity, two experts did a second round of review to examine the remaining items for clarity and domain appropriateness. They also classified the items into the four domains. The research team checked the items and made revisions accordingly. The goal was to have items that distinctively assessed one of the four domains and revise or remove items that were unclear. The final item pool for the scale consisted of 29 items.
Selection of Final Items. With Sample 1 (N = 262), exploratory factor analyses were used to select the 14 CCLS items and to determine 3 factors: Belonging-Competency, National Privileges, and Access to Home Familiarity. With Sample 2 (N = 256), confirmatory factor analyses cross-validated the 3-factor oblique model as well as a bifactor model.
Samples
Sample 1. The first sample was used for exploratory factor analysis to determine scale items and examine initial reliability and validity. Participants were 262 international students (147 women, 114 men, 1 transgender) studying in the U.S. Mean age was 26.9 years (SD = 5.9). The participants came from 64 countries, with India (23%), China (13%), South Korea (5%) being the top three countries of origin. The majority were graduate students (73%). Participants were studying at various states across the U.S., with Illinois (20%), Indiana (13%), Kansas (12%), and Missouri (12%) rounding up the top four locations. Engineering (16%), Business and Management (15%), Physical and Life Science (14%), and Social Sciences (11%) were among the top majors. Participants had lived in the U.S. for an average of 36.2 months (SD = 32.2).
Sample 2. The second sample was mainly used for confirmatory factor analysis to cross-validate the factor structure and examine additional reliability and validity. Participants were 256 international students (144 women, 112 men) studying in the U.S. Their mean age was 27.0 years (SD = 5.6). The participants came from 67 different countries, with China (16%), India (15%), Brazil (5%) being the top three countries of origin. The majority were graduate students (72%). Participants were studying at various states across the U.S., with Illinois (18%), Missouri (14%), Tennessee (12%), and Kansas (12%) rounding up the top four locations. Business and Management (18%), Social Sciences (13%), Physical and Life Science (12%), and Engineering (11%) were among the most studied fields. Participants had been living in the U.S. for an average of 31.8 months (SD = 33.2).
Item analyses
Item Selection – Exploratory Factor Analysis. We first conducted exploratory factor analyses (EFA) for item selection with sample 1 (N = 262). Following recommendations from Brown (2006) to use consistent methods across EFA and CFA, all factor analyses were conducted in Mplus 7 with robust maximum likelihood (MLR) as the estimator and Geomin as the rotation method. To determine the number of factors, we conducted a parallel analysis by comparing initial eigenvalues of this sample with those generated through random data; the comparison suggested a three- factor solution. Because we initially used four domains to create the item pool, we conducted exploratory factor analyses on the 29 items with three- to five-factor solutions using an oblique rotation method (i.e., Geomin), due to the expected inter-factor correlations in this multifactorial model (Brown, 2006). The most interpretable solution was a three-factor oblique-rotation solution because, for the four- and five- factors solutions, there were no more than three factors that consisted of items without significant cross-loadings.
Through a series of EFAs, we retained 14 items for the final CCLS (six in Belonging-Competency, four in National Privileges, and four in Access to Home Familiarity). Each of the items representing the three factors and their factor loadings, means, and standard deviations are presented in Table 2. The loadings on the corresponding factor were all significant and above .40 and without any significant cross-loadings at p < .05 level. The three-factor solution accounted for 57.2% of the total variance explained before rotation. The six Belonging-Competency items all originated from those two theoretically defined domains with loadings ranging from .55 to .86 after rotation. The corresponding factor accounted for 33.3% of the total variance before rotation. The four Access to Home Familiarity items all originated from that theoretically defined domain with loadings ranging from .44 to .90 after rotation. The corresponding factor accounted for 12.9% of the total variance before rotation. The four National Privileges items also all originated from that theoretically defined domain with loadings ranging from .41 to .69 after rotation. The corresponding factor accounted for 11.1% of the total variance before rotation. The correlations among the three factors were .37 between Belonging-Competency and Access to Home Familiarity, .44 between Belonging-Competency and National Privileges, and .23 between Access to Home Familiarity and National Privileges.
Table 2
Items, Factor Loadings, Means, and Standard Deviations for the CCLS
|
Item no. |
Subdomains and corresponding items |
factors |
|
|||||||||
|
1 |
2 |
3 |
M |
S.D. |
||||||||
|
Belonging-Competency |
||||||||||||
|
11. |
feel less connected to others around you |
.86 |
-.04 |
-.02 |
2.50 |
1.11 |
||||||
|
6. |
have a more difficult time fitting in with others |
.81 |
.06 |
-.02 |
2.42 |
1.10 |
||||||
|
12. |
are less certain about how to behave appropriately in daily life |
.71 |
-.01 |
.14 |
2.25 |
1.13 |
||||||
|
4. |
have fewer opportunities for intimate relationships |
.68 |
-.08 |
.00 |
2.68 |
1.25 |
||||||
|
14. |
feel less engaged to daily topics in your surrounding |
.61 |
.02 |
.13 |
2.61 |
1.13 |
||||||
|
5. |
have less knowledge of the resources available in your environment |
.55 |
.09 |
.07 |
2.66 |
1.08 |
||||||
|
Access to Home Familiarity |
|
|||||||||||
|
7. |
have less access to the cultural environment of home |
.00 |
.90 |
.00 |
3.00 |
1.20 |
||||||
|
8. |
have less access to entertainment from your home country |
-.01 |
.69 |
-.01 |
2.80 |
1.24 |
||||||
|
9. |
have less access to food from your country |
.05 |
.48 |
.00 |
3.13 |
1.20 |
||||||
|
1. |
have less in-person access to family members in your home country |
.01 |
.44 |
.05 |
3.52 |
1.22 |
||||||
|
National Privileges |
|
|||||||||||
|
3. |
experience more restrictions as a foreigner |
.00 |
.08 |
.69 |
2.98 |
1.15 |
||||||
|
10. |
sense a loss of civil rights (e.g., employment, vote) |
.02 |
-.02 |
.65 |
2.88 |
1.35 |
||||||
|
13. |
have to deal with additional requirements to stay in this new country |
.00 |
-.03 |
.63 |
3.33 |
1.21 |
||||||
|
2. |
have less access to welfare (e.g., health care, benefits) for citizens |
-.03 |
.02 |
.41 |
3.05 |
1.25 |
||||||
|
Note. Final 14 CCLS items. Unique factor loadings significant at p < .05 are in bold. N = 262 participants. Factor 1 = Belonging-Competency; Factor 2 = Access to Home Familiarity, Factor 3 = National Privileges. |
||||||||||||
Cross-Validation – Confirmatory Factor Analysis. Confirmatory factor analysis (CFA) was conducted with sample 2 (N = 256) using Mplus 7 to cross-validate the measurement qualities of the CCLS using MLR as the estimator due to minor deviations from normality on a few CCLS scale items. Geomin was used as the rotation method, which is the default and recommended oblique rotation method in Mplus. First we specified a three-factor oblique model, where the 14 CCLS items were constrained to load onto their corresponding factors based on the EFA results and the three factors were permitted to correlate with one another (see Figure 1). The range of standardized factor loadings for the factors was: .61 to .85 for Belonging-Competency, .52 to .72 for National Privileges, and .53 to .79 for Access to Home Familiarity. The fit statistics for this three-factor oblique model [CFI = .971, SRMR = .038, RMSEA = .041] were strong based on guidelines from Hu and Bentler (1999) (see Table 3). We also examined three competing models: a three-factor orthogonal model, a bifactor model (i.e., each item loads on a general Cross-Cultural Loss factor and one of the three orthogonal factors), and a one-factor model. The fit indices for all four models are presented in Table 3. Based on the general guidelines, the CFI, SRMR, and RMSEA all indicated an adequate data to model fit for both the three-factor oblique and the bifactor model (see Figure 2), but not the three-factor orthogonal model or one-factor model. To compare between the three-factor oblique and the bifactor model, we examined the Akaike information criteria (AIC) and the Bayesian information criteria (BIC). A slightly smaller AIC and BIC indicated that the three-factor oblique model was better, however, the bifactor model was comparable with slightly higher CFI and lower SRMR.
Table 3
Goodness-of-Fit Indicators for the Competing Models of the 14-Item CCLS
|
Model |
MLRχ2 |
df |
CFI |
RMSEA [CI] |
SRMR |
BIC |
AIC |
|
Three-factor oblique |
106.34 |
74 |
.971 |
.041 [.022-.058] |
.038 |
10587.88 |
10428.35 |
|
Three-factor orthogonal |
263.05 |
77 |
.835 |
.097 [.084-.110] |
.210 |
10744.12 |
10595.22 |
|
Bifactor |
94.15 |
63 |
.972 |
.044 [.024-.062] |
.032 |
10634.47 |
10435.94 |
|
One-factor |
299.94 |
77 |
.802 |
.106 [.094-.119] |
.082 |
10791.41 |
10642.52 |
|
Note. N = 256. CCLS = Cross-Cultural Loss Scale; MLRχ2 = Robust Maximum Likelihood chi-square, df = degrees of freedom, CFI = comparative fit index; RMSEA = root-mean-square error of approximation; CI = confidence interval for RMSEA; SRMR = standardized root-mean-square residual; BIC = Bayesian Information Criteria; AIC = Akaike Information Criteria. Fit indices for the bifactor model is slightly different from the ones published in the journal article due to restricting the error variances to be estimated positively in a later analysis. |
|||||||
Figure 1
Three-factor Oblique Model
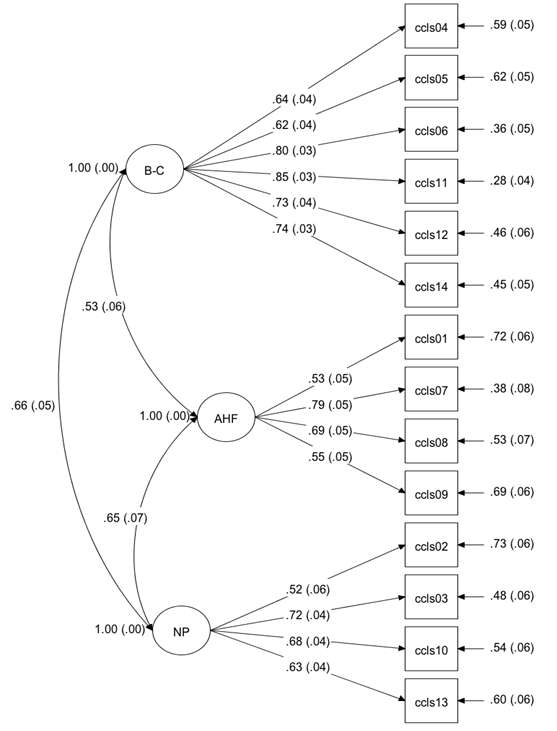
Note. N = 256. CCLS = Cross-Cultural Loss Scale, B-C = Belonging-Competency; AHF = Access to Home Familiarity, NP = National Privileges. Numbers of item labels correspond to item numbering in Table 1 .Standardized coefficients (STDXY) are shown in figure with standard errors in brackets.
Figure 2
Bifactor Model
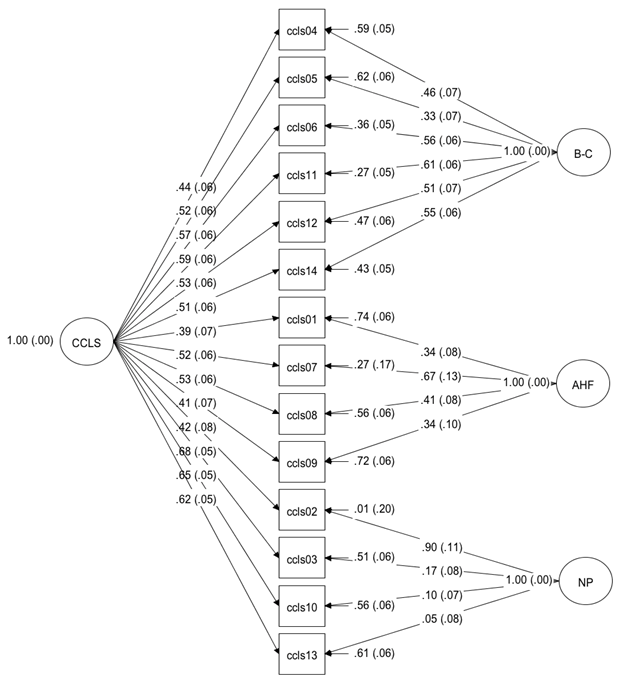
Note. N = 256. CCLS = Cross-Cultural Loss Scale, B-C = Belonging-Competency; AHF = Access to Home Familiarity, NP = National Privileges. Numbers of item labels correspond to item numbering in Table 1 .Standardized coefficients (STDXY) are shown in figure with standard errors in brackets.
Objectivity
The CCLS is a standardized measurement tool and can be objectively used by researchers. The instructions and scale items, response format, and scoring key are all standardized. Scores of CCLS can be objectively compared across researchers and studies.
Reliability
Sample 1. The internal consistency reliability for the CCLS total and subscale scores were overall adequate with Cronbach alphas all above .70 with the exception of the National Privileges subscale scores (.68) in sample 1. The CCLS total score had a Cronbach alpha of .83 and the CCLS subscale scores had Cronbach alphas ranging from .68 to .87. The ranges of corrected item-total correlations for the CCLS subscale scores were: .60 to .75 for Belonging-Competency, .34 to .54 for Access to Home Familiarity, and .40 to .66 for National Privileges.
Sample 2. The internal consistency reliability for the CCLS total and subscale scores was overall adequate with Cronbach alphas all above .70 in sample 2. The CCLS total score had a Cronbach alpha of .87 and the CCLS subscale scores had Cronbach alphas ranging from .73 to .87. The ranges of corrected item-total correlations for the CCLS subscale scores were: .58 to .77 for Belonging-Competency, .44 to .64 for Access to Home Familiarity, and .46 to .58 for National Privileges. Based on the bifactor model, omega (ω) and omega hierarchical (ωh) (Brunner, Nagy, & Wilhelm, 2012) for each subscale and CCLS total score are as following: w = .87, wh = .42 for Belonging-Competency, w = .74, wh = .35 for Access to Home Familiarity, w = .81, wh = .17 for National Privileges, and w = .91, wh = .73 for CCLS total score.
Validity
To examine construct validity, we use the following measures: Satisfaction with Life Scale (SWLS; Diener, Emmons, Larsen, & Griffin, 1985), Positive and Negative Affect Schedule (PANAS; Watson, Clark, & Tellegen, 1988), Migratory Grief and Loss Questionnaire (MGLQ; Casado et al., 2010), Perceived Discrimination Subscale from the Acculturative Stress Scale for International Students (ASSIS; Sandhu & Asrabadi, 1994), Social Connectedness in the Ethnic Community Scale (SCETH) and Social Connectedness in Mainstream Society Scale (SCMN; Yoon, 2006). We also used Perceived English Proficiency (PEP; Wei, Liao, Heppner, Chao, & Ku, 2012) and length of time in the US to investigate criterion validity.
Sample 1 - Construct Validity. To examine the construct validity of the CCLS, we conducted manifest correlations between the CCLS total score, the CCLS subscale scores and the study variables described above with sample 1 (Table 4). Based on Cohen (1988), a correlation coefficient of .10 is considered a weak association; a correlation coefficient of .30 is considered a moderate association; and a correlation coefficient of .50 or larger is considered a strong association. The CCLS total and subscale scores in general showed significant moderate positive correlations with measures of migration grief and loss, negative affect, and discrimination, which supported the convergent validity of this new measure. Furthermore we expected negative associations between both life satisfaction and positive affect and CCLS total and its subdomains. Here we found significant negative correlations only between life satisfaction and CCLS total and the subdomain Belongingness-Competency, respectively, representing mixed support for convergent construct validity. Next, we tested the construct validity across gender. We conducted a series of multiple group analyses to examine whether the magnitude of the manifest correlations between each of the four CCLS scores (i.e., total score and three subscale scores) and the five variables measured for validity (i.e., life satisfaction, positive affect, negative affect, migration grief and loss, and discrimination) were equivalent for men and women. For each of the CCLS total and subscale scores, we compared two models, an unconstrained model (i.e., the correlations of the CCLS score with the five variables measured for validity were allowed to vary across genders) and a constrained model (i.e., the correlations of the CCLS score with the five variables measured for validity were set to be identical across genders). The non-significant chi-square difference tests indicated that the magnitudes of correlations were invariant across genders for all the CCLS total and subscale scores with ΔMLRχ2(5, N = 261) ranging from 1.72 to 6.29 (p = .28 to .89). The CCLS subscale scores were differently associated with English proficiency and length of time in the U.S. More specifically, loss of Belonging-Competency was negatively associated with English proficiency. Length of time in the U.S. was negatively associated with loss of Belonging-Competency and positively associated with loss of National Privileges.
Table 4
Intercorrelations Between CCLS Subscale Scores and Study Variables in Sample 1
|
|
CCLS |
BC |
AHF |
NP |
|
CCLS Total [CCLS] |
|
|
|
|
|
Belonging-Competency [BC] |
.85** |
|
|
|
|
Access to Home Familiarity [AHF] |
.65** |
.32** |
|
|
|
National Privileges [NP] |
.68** |
.39** |
.20* |
|
|
Life Satisfaction |
-.19* |
-.26** |
.01 |
-.11 |
|
Positive Affect |
-.12 |
-.16 |
-.05 |
-.02 |
|
Negative Affect |
.43** |
.42** |
.26** |
.22** |
|
Migration Grief & Loss |
.33** |
.34** |
.20* |
.16* |
|
Discrimination |
.51** |
.44** |
.24** |
.45** |
|
English Proficiency |
-.26** |
-.41** |
.02 |
-.08 |
|
Length of Time in U.S. |
-.02 |
-.22** |
.07 |
.21* |
|
Note. N = 262. * p < .01, ** p < .001. CCLS Total was computed by summing the three CCLS subscale scores. |
||||
Sample 1 - Incremental Validity. We conducted two hierarchical regressions to examine the incremental validity of the CCLS total and National Privileges subscale scores. A subjective well-being composite score (i.e., subtracting the z-scores of negative affect from the sum of life satisfaction and positive affect z-scores) was the dependent variable. First, we examined the CCLS total scores’ incremental predictability over and above MGLQ scores, and then the CCLS National Privileges’ incremental predictability over and above ASSIS Discrimination scores. For each separate regression analyses, in step 1, we entered the related study variable. In step 2, the CCLS total or subscale scores were entered (see Table 5). The incremental variances explained by CCLS total scores in predicting subjective well-being above and beyond MGLQ scores was 8%. This result suggested that CCLS is a different construct from the previous migration grief and loss measured by MGLQ in predicting subjective well-being. However, loss of National Privileges did not predict subjective well-being above and beyond perceived Discrimination.
|
Table 5
Hierarchical Regressions for Incremental Validity in Predicting Subjective Well-Being Above and Beyond Related Variables in Samples 1 and 2 |
||||||
|
|
B |
S.E. |
β |
ΔR2 |
ΔF |
dfs |
|
Sample 1 (N = 262) |
||||||
|
CCLS-Total Score |
||||||
|
Step 1 |
|
|
|
.05*** |
13.37 |
1, 260 |
|
Migration Grief & Loss |
-.07 |
.02 |
-.22*** |
|
|
|
|
Step 2 |
|
|
|
.08*** |
23.11 |
1, 259 |
|
Migration Grief & Loss |
-.04 |
.02 |
-.12* |
|
|
|
|
CCLS-Total Score |
-.07 |
.02 |
-.30*** |
|
|
|
|
National Privileges |
||||||
|
Step 1 |
|
|
|
.12*** |
35.28 |
1, 260 |
|
Discrimination |
-.11 |
.02 |
-.35*** |
|
|
|
|
Step 2 |
|
|
|
.00 |
.02 |
1, 259 |
|
Discrimination |
-.11 |
.02 |
-.34*** |
|
|
|
|
CCLS-National Privileges |
.00 |
.04 |
-.01 |
|
|
|
|
Sample 2 (N = 256) |
||||||
|
Belonging-Competency |
||||||
|
Step 1 |
|
|
|
.41*** |
87.38 |
1, 253 |
|
Social Connection-Mainstream |
.11 |
.02 |
.34*** |
|
|
|
|
General Self-Efficacy |
.21 |
.03 |
.43*** |
|
|
|
|
Step 2 |
|
|
|
.04*** |
17.01 |
1, 252 |
|
Social Connection-Mainstream |
.07 |
.02 |
.21*** |
|
|
|
|
General Self-Efficacy |
.19 |
.03 |
.39*** |
|
|
|
|
CCLS-Belonging-Competency |
-.10 |
.02 |
-.24*** |
|
|
|
|
Access to Home Familiarity |
||||||
|
Step 1 |
|
|
|
.02* |
4.67 |
1, 254 |
|
Social Connection-Ethnic Group |
.05 |
.02 |
.13* |
|
|
|
|
Step 2 |
|
|
|
.05*** |
13.50 |
1, 253 |
|
Social Connection-Ethnic Group |
.05 |
.02 |
.14* |
|
|
|
|
CCLS-Access to Home Familiarity |
-.14 |
.04 |
-.22*** |
|
|
|
|
Note. *p < .05 and *** p < .001. |
||||||
Sample 2 - Construct Validity. To examine the construct validity of the CCLS, we conducted manifest correlations between the CCLS total score, the CCLS subscale scores and the study variables described above with sample 2 (Table 6). The CCLS total and subscale scores overall had moderate correlations with measures of subjective well-being (i.e., life satisfaction, positive affect, and negative affect), general self-efficacy, and social connection with mainstream society in the expected directions, which supported the construct validity of this scale. None of the CCLS total and subscale scores correlated significantly with social connection with ethnic group. Following the methods used for Sample 1, we examined whether the magnitude of the correlations between the CCLS (i.e., total score and 3 subscale scores) and the six variables measured for validity (i.e., life satisfaction, positive affect, negative affect, general self-efficacy, social connection with mainstream society, and social connection with ethnic group) were equivalent for men and women. The results indicated that the magnitudes of correlations were invariant across genders for the CCLS total and all subscale scores with MLRΔχ2 (6, N = 256) ranging from 2.61 to 6.74 (p = .35 to .86). English proficiency was negatively associated with CCLS Belonging-Competency; whereas length of time in the U.S. was positively associated with loss of National Privileges.
Table 6
Intercorrelations Between CCLS Subscale Scores and Study Variables in Sample 2
|
|
CCLS |
BC |
AHF |
NP |
|
CCLS Total [CCLS] |
|
|
|
|
|
Belonging-Competency [BC] |
.86** |
|
|
|
|
Access to Home Familiarity [AHF] |
.75** |
.43** |
|
|
|
National Privileges [NP] |
.81** |
.52** |
.49** |
|
|
Life Satisfaction |
-.41** |
-.42** |
-.21* |
-.33** |
|
Positive Affect |
-.31** |
-.41** |
-.09 |
-.18* |
|
Negative Affect |
.31** |
.32** |
.20* |
.21* |
|
General Self-Efficacy |
-.32** |
-.37** |
-.17* |
-.18* |
|
Social Connection-Mainstream |
-.51** |
-.59** |
-.28** |
-.28** |
|
Social Connection-Ethnic Group |
.01 |
.00 |
.02 |
.00 |
|
English Proficiency |
-.14 |
-.31** |
.08 |
-.02 |
|
Length of Time in U.S. |
.11 |
-.01 |
.13 |
.21* |
|
Note. N = 256. * p < .01, ** p < .001. CCLS Total was computed by summing the three CCLS subscale scores. |
||||
Sample 2 - Incremental Validity. Using the same method as Sample 1, we examined the incremental validity of the CCLS Belonging-Competency, and Access to Home Familiarity subscale scores over and above related constructs. The CCLS subscales loss of Belonging-Competency and Access to Home Familiarity predicted subjective well-being above and beyond Social Connection with Mainstream Society and General Self-Efficacy, and Social Connection with Ethnic Community, respectively. The incremental variances in predicting subjective well-being ranged from 4% - 5% (see Table 5). These results provided support for the incremental validity of these two CCLS subscales.
Descriptive statistics
Means, standard deviations, skewness, and kurtosis are presented in Table 7, and correlations are presented in Table 4 and Table 6.
Table 7
Mean, Standard Deviations, Skewness, and Kurtosis
|
|
|
Sample 1 |
Sample 2 |
||||||
|
|
range |
Mean |
S.D. |
skew |
kurt |
Mean |
S.D. |
skew |
kurt |
|
1. CCLS Total [CCLS] |
14-70 |
39.82 |
9.24 |
.31 |
-.26 |
39.49 |
10.61 |
.21 |
-.44 |
|
2. Belonging-Competency [BC] |
6-30 |
15.13 |
5.32 |
.41 |
-.45 |
15.02 |
5.54 |
.44 |
-.54 |
|
3. Access to Home Familiarity [AHF] |
4-20 |
12.45 |
3.57 |
-.11 |
-.61 |
12.52 |
3.67 |
-.19 |
-.61 |
|
4. National Privileges [NP] |
4-20 |
12.25 |
3.55 |
-.19 |
-.48 |
11.95 |
3.85 |
.16 |
-.74 |
|
Note: Sample 1: N = 262, Sample 2: N = 256. Presented values are based on sum scores. |
|||||||||
Further quality criteria
Measurement Invariance across Genders. We also specified the three-factor oblique model within a multiple-group CFA to examine measurement invariance between men and women using a forward (sequential constraint imposition) approach based on Dimitrov’s (2010) guidelines (see Table 8). We conducted these analyses collapsed across sample 1 and sample 2 for a larger combined sample size. The first step involved examining the model for each group separately. Results indicated adequate fit for both groups [men: MLRχ2(74, N = 226) = 89.96, p = .10, CFI = .979, RMSEA = .031, SRMR = .042; women: MLRχ2(74, N = 291) = 120.97, p < .001, CFI = .965, RMSEA = .047, SRMR = .040]. Measurement invariance was examined next, which involved establishing a baseline model (Model 0: Model without constraints across groups), and then testing for equal factor loadings across groups (Model 1: Invariant Factor Loadings Model), additionally equal item intercepts across groups (Model 2: Invariant Factor Loadings and Intercepts Model), and further equal item error variances across groups (Model 3: Invariant Factor Loadings, Intercepts, and Residual Variances Model). Nested models were compared using MLR scaled chi-square difference tests. A nonsignificant MLRΔχ2 difference between M1 and M0 [MLRΔχ2(11) = 11.53, p = .44] indicated metric invariance (i.e., invariant factor loadings). The MLRΔχ2 between M2 and M1 was nonsignificant [MLRΔχ2(11) = 15.89, p = .14], indicating that the intercepts were also invariant across the two gender groups. The nonsignificant MLRΔχ2 difference between M3 and M2 [MLRΔχ2(14) = 20.31, p = .12] indicated that residual variances were also invariant across genders. In sum, multiple-group CFA results indicate that the CCLS fulfilled the strictest level of measurement invariance between men and women in this sample. Thus, the CCLS can be used to both genders equivalently.
Table 8
Testing for Measurement and Structural Invariance Across Gender Groups
|
|
MLRχ2 |
df |
M comp |
MLRΔχ2 |
∆df |
CFI |
RMSEA |
SRMR |
|
Male |
89.96 |
74 |
|
|
|
.979 |
.031 |
.042 |
|
Female |
120.97 |
74 |
|
|
|
.965 |
.047 |
.040 |
|
[M0] Unconstrained |
209.96 |
148 |
|
|
|
.970 |
.040 |
.041 |
|
[M1] Loadings |
222.09 |
159 |
M1-M0 |
11.53 |
11 |
.970 |
.039 |
.045 |
|
[M2] Loadings, Intercepts |
237.93 |
170 |
M2-M1 |
15.89 |
11 |
.968 |
.039 |
.047 |
|
[M3] Loadings, Intercepts, Residual Variances |
258.16 |
184 |
M3-M2 |
20.31 |
14 |
.965 |
.039 |
.052 |
|
Note. N = 517 (291 women, 226 men). |
||||||||
Further literature
Wang, K. T., Wei, M., Zhao, R., Chuang, C. C., & Li, F. (2015). The Cross-Cultural Loss Scale: Development and psychometric evaluation. Psychological Assessment, 27, 42-53. doi:10.1037/pas0000027
Kenneth T. Wang; Fuller Theological Seminary, School of Psychology; E-Mail: ktwang@fuller.edu