Social Desirability-Gamma Short Scale (KSE-G)
Autor/in:
Nießen, D., Partsch, M. V., Kemper, C. J., & Rammstedt, B.
In ZIS seit:
2019
Downloads
Aktionen
Nutzungsbedingungen
Zur Nutzung für andere Zwecke kontaktieren Sie die Autor*innen
Zusammenfassung:
Abstract:
The Social Desirability-Gamma Short Scale - the English-language adaptation of the Kurzskala Soziale Erwünschtheit-Gamma (KSE-G) - measures two aspects of the Gamma factor of socially desirable responding (SDR): exaggerating positive qualities (PQ+) and minimizing negative qualities (NQ−). The items of the German-language source version were translated into English using the TRAPD approach. Our empirical validation shows that the reliability and validity coefficients of the English adaptation are comparable to those of the German source instrument. Moreover, the results of measurement invariance testing suggest metric measurement invariance of the scale for the United Kingdom and Germany, thus implying comparability of correlations based on the latent factors across the two countries.
Sprache Dokumentation:
English
Sprache Items:
English, German (source)
Anzahl der Items:
6
Erhebungsmodus:
CASI
Bearbeitungszeit:
< 1 min
Reliabilität:
retest = .64; Cronbach's alpha ≥ .65; McDonald's omega ≥ .67
Validität:
evidence for factorial, construct, and criterion validity
Konstrukt:
social desirability (exaggerating positive qualities, minimizing negative qualities)
Schlagwörter:
social desirability, response behavior
Item(s) in Bevölkerungsumfrage eingesetzt:
yes
Skalenentwicklung:
<p>A study by Bass et al. (2023) provides additional evidence for the scale's reliability and validity. In a sample of<em> N </em>= 187 australian midwifery students and midwives the authors found an internal consistency of α = .64 as well as a correlation with the holistic reflection scale (<em>r</em> =.23). For more information please see: https://doi.org/10.1016/j.wombi.2021.10.001</p>
Instruction
"The following statements may apply more or less to you personally. Please indicate to what extent they apply to you."
Items
Table 1
Items of the English-Language Adaptation of the Social Desirability-Gamma Short Scale
|
No. |
Item |
Subscale |
|
1 |
In an argument, I always remain objective and stick to the facts. |
PQ+ |
|
2 |
Even if I am feeling stressed, I am always friendly and polite to others. |
PQ+ |
|
3 |
When talking to someone, I always listen carefully to what the other person says. |
PQ+ |
|
4 |
It has happened that I have taken advantage of someone in the past. |
NQ− |
|
5 |
I have occasionally thrown litter away in the countryside or on to the road. |
NQ− |
|
6 |
Sometimes I only help people if I expect to get something in return. |
NQ− |
Note. PQ+ = exaggerating positive qualities; NQ− = minimizing negative qualities.
Response specifications
Items are answered using a 5-point rating scale ranging from doesn't apply at all (1) to applies completely (5).[1]
Scoring
The KSE-G (Kurzskala Soziale Erwünschtheit–Gamma [Social Desirability–Gamma Short Scale]) consists of six items covering the two aspects of the Gamma factor of social desirability, namely exaggerating positive qualities (PQ+) and minimizing negative qualities (NQ−). The English adaptations of these items are displayed in Table 1 (for the original German items, see Kemper, Beierlein, Bensch, Kovaleva, & Rammstedt, 2014). As in the German source instrument, all items are formulated positively in the direction of the underlying aspect. The scale score of social desirability is computed separately for each subscale (PQ+ and NQ−). For this purpose, the unweighted mean score of the three items of each subscale is computed. We suggest that individual answers should be aggregated to the scale level only if there are no missing values.
Application field
Social desirability is a response tendency that biases individual item responses, thereby leading to deviation from true scores. High scores on socially desirable responding (SDR) scales, and high correlations between SDR scales and self-report instruments, indicate a possible distortion of respondents’ answers on self-report questionnaires (Paulhus & Trapnell, 2008). Due to its short completion time (< 1 min), the instrument can be applied in research settings with severe time limitations, for example, large-scale surveys, and can be used to check whether questionnaire responses are biased by SDR. The original German-language KSE-G has been validated for the adult population in Germany; it was adapted in the present research to English and validated in the United Kingdom, irrespective of age and social class. The scale is metrically invariant across the two countries and can thus be applied in international assessments. The KSE-G is typically self-administrated, such as via paper-and-pencil or online questionnaire. However, provided slight adaptations to the instructions, an oral administration in a personal interview or telephone interview is also conceivable.
[1] Note that Kemper et al. (2014) coded the items from 0 to 4.
Socially desirable responding is defined as the "tendency to give overly positive self-descriptions" (Paulhus, 2002, p. 50) "in order to put forward a more socially acceptable self-image" (Haghighat, 2007). The construct has been investigated in psychological research for over 60 years now. There is a broad range of approaches operationalizing SDR, and many scales have been developed over the years (for an overview, see, e.g., Paulhus, 1991a; Paulhus, 2002; Paulhus & Trapnell, 2008).
A widespread, comprehensive, and integrative conceptualization of the SDR construct was developed over the years by Delroy Paulhus. Initially, Paulhus (1984, 1986) assumed that SDR consisted of the two relatively independent factors: (conscious) impression management (IM) - also known as Gamma - and (unconscious) self-deceptive enhancement (SDE) - also known as Alpha (Wiggins, 1964).[2] However, a series of studies with instructional manipulations yielded evidence for associating Gamma and Alpha with the so-called Big Two (Paulhus & Trapnell, 2008), namely communion and agency (Bakan, 1966). This research indicated that respondents interpreted instructions to "respond in a socially desirable way" to mean that they should claim communal attributes (e.g., responsibility, cooperativeness), which led to higher scores on Gamma measures than on Alpha measures (Paulhus & Trapnell, 2008, p. 502). By contrast, respondents interpreted instructions to "respond as if you are strong and competent" to mean that they should claim agentic attributes (i.e., prominence, status; Paulhus & John, 1998), which resulted in higher scores on Alpha measures than on Gamma measures (Paulhus, Tanchuk, & Wehr, 1999, as cited in Paulhus & Trapnell, 2008, p. 502).
Based on these findings, Paulhus (2002) developed an integrative model (further elucidated in Paulhus & Trapnell, 2008), in which he considered both a content distinction of SDR (communion- vs. agency-induced SDR) and an audience distinction (IM induced by a public audience vs. SDE induced by a private audience, i.e., the self). From this integrative model, a revised Gamma factor (communion) of SDR and a revised Alpha factor (agency) were derived, both of which have IM and SDE components.
Communion-related SDR (i.e., the revised Gamma factor) involves "excessive adherence to group norms and minimization of social deviance" (Paulhus & Trapnell, 2008, p. 498); it is related to qualities such as cooperativeness, warmth, and dutifulness. Communion management describes the communal aspect of IM and "involves excuse making and damage control" (Paulhus & Trapnell, 2008, p. 503). Moralistic bias describes the communal aspect of SDE. It is defined as a "self-deceptive tendency to deny socially deviant impulses and to claim sanctimonious 'saint-like' attributes" (Paulhus & John, 1998, p. 1026). This tendency manifests itself in "overly positive self-perceptions" on personality traits associated with communion, such as "agreeableness, dutifulness, and restraint" (Paulhus & John, 1998, p. 1026). In contrast, agency-related SDR (i.e., the revised Alpha factor) involves "exaggerated achievement striving and self-importance" (Paulhus & Trapnell, 2008, p. 498) and is associated with qualities such as strength, competence, and cleverness. Agency management describes the agentic aspect of IM and manifests itself, for example, in bragging. Egoistic bias describes the agentic aspect of SDE and is understood as a self-deceptive tendency to exaggerate one's social and intellectual status. This leads to unrealistically positive self-perceptions on personality traits associated with agency, such as "dominance, fearlessness, emotional stability, intellect, and creativity" (Paulhus & John, 1998, p. 1026).
The two SDR factors are associated with different personality traits. Gamma shows the strongest positive correlations with Agreeableness, followed by Conscientiousness and, to a lesser extent, Emotional Stability. Alpha shows the strongest positive correlations with Emotional Stability, followed by Conscientiousness, Extraversion, and, to a lesser extent, Openness and Agreeableness (Hart, Ritchie, Hepper, & Gebauer, 2015; Li & Bagger, 2006; Paulhus, 1988).
In the early years of SDR research, scales were not designed to distinguish between different facets of SDR but rather were constituted as unidimensional measures linked to different conceptions of SDR (e.g., the Edwards Social Desirability Scale [ESD], Edwards, 1957; the Wiggins Social Desirability Scale [Wsd], Wiggins, 1959; the Marlowe-Crowne Social Desirability Scale [MC-SDS], Crowne & Marlowe, 1960). In contrast, Paulhus (1991b, 1998) developed a two-dimensional measure—the Balanced Inventory of Desirable Responding (BIDR)—based on his concept of the two dimensions of SDR, namely IM and SDE. This approach is widely accepted in the current research on SDR (e.g., Asgeirsdottir, Vésteinsdóttir, & Thorsdottir, 2016; Hart et al., 2015; Stöber, 2001; Wiggins, 2003). Short measures were derived from the full scales measuring either a unidimensional or a bi-dimensional SDR concept. These short scales include the Balanced Inventory of Desirable Responding Short Form (BIDR-16; Hart et al., 2015), which comprises 16 items, or the Social Desirability Scale-17 (SDS-17; Stöber, 2001), which consists of 17 items.
However, as numerous studies (e.g., Paulhus, 1984; Paulhus & Reid, 1991; but see Li & Bagger, 2006) had indicated that Gamma seemed to bias self-reported behavior, personality characteristics, and attitudes more than Alpha, a scale was needed that identified a person's tendency for socially desirable responding in terms of Gamma. Social-scientific self-report surveys often refer to the social significance of the survey in order to increase the willingness to participate. In such situations, the moralistic bias, which is induced by the assessment setting, could be increased further. Respondents could therefore strive to answer like a "nice person", "well socialized", or "good person" (Paulhus & Trapnell, 2008) leading to deviation from true scores. In particular, an ultra-short instrument was lacking that was suitable even for extremely time-restricted surveys and that tapped only the relevant comprehensive and revised understanding of Gamma encompassing communion management and moralistic bias.
That is why Kemper et al. (2014) developed the KSE-G, a short scale to assess the Gamma SDR factor, that is, communion-induced SDR reflected both in IM and SDE. When constructing the scale, they identified two subscales of SDR-Gamma. To be more precise, Kemper et al. (2014) did not expect to find these two dimensions. Instead, they detected them factor analytically, checked them with a confirmatory factor analysis (CFA), and were able to replicate them in the further construction process. Following Roth, Snyder, and Pace (1986), who also found these two dimensions, they labelled these subscales exaggerating positive qualities and minimizing negative qualities of the self.[3] Subscales were considered to be somewhat related but largely independent internally homogenous item clusters which reflect that some respondents "systematically overreport their performance of a wide variety of desirable behaviors and underreport undesirable behaviors" (Paulhus, 1991a, p. 37). The items of one dimension describe polite, sociable, and adapted behaviors that are socially desirable but rare, and the items of the other one describe inappropriate behaviors that are socially undesirable but frequent. These contents are intended to reflect Gamma values (communion) in particular.
[2] The neutral designations Gamma and Alpha are two of a total of six for two out of six factors representing stylistic scales in the Minnesota Multiphasic Personality Inventory (MMPI; Hathaway & McKinley, 1951).
[3] The exact labels in Roth et al. (1986) are attributing the existence of positive characteristics and denying the presence of negative qualities.
Item generation and selection
To develop the KSE-G, Kemper et al. (2014) drew on items from existing social desirability scales, such as the Soziale-Erwünschtheits-Skala-17 (SES-17; Stöber, 1999), a German-language adaptation of the SDS-17 (Stöber, 2001), and a German-language adaptation of the MC-SDS (Lück & Timaeus, 1969). These items were revised to make them more comprehensible and content valid. The revised items were then tested using item and structural analysis. In an iterative process, the authors discarded some items and replaced them with newly developed ones (for more detailed information, see Kemper et al., 2014). The German-language KSE-G was thoroughly validated based on a comprehensive sample that reflected the adult German population. To enhance the usability of the KSE-G, the scale was translated and adapted to English by translating the items following the so-called TRAPD approach (Harkness, 2003). First, two professional translators (native speakers) translated the items independently of each other into British English and American English, respectively. Second, an alignment meeting was held where psychological experts, the two translators, and an expert in questionnaire translation reviewed the various translation proposals and developed the final translation.
The source instrument by Kemper et al. (2014) was developed in and validated for the German language. The aim of the present study was to validate the English-language adaptation of the KSE-G and to directly compare its psychometric properties with those of the German source version. In line with earlier findings, we expected strongest correlations with Agreeableness, followed by Conscientiousness and Emotional Stability, and small correlations with Openness and Extraversion (Hart et al, 2015; Kemper et al., 2014; Li & Bagger, 2006; Paulhus, 1988; Paulhus, 2002; Stöber, 2001).
Samples
To investigate the psychometric properties of the English adaptation of the KSE-G, and their comparability with those of the German source instrument, we assessed both versions in a web-based survey (computer-assisted self-administered interviewing [CASI]) conducted in the United Kingdom (UK) and in Germany (DE) by the online access panel provider respondi AG. Fielding took place in January 2018. For both countries, quota samples were drawn that reflected the heterogeneity of the adult population with regard to age, gender, and educational attainment. Only native speakers of the respective languages were recruited. We explained our research goal (investigation of the quality of several questionnaires) to the participants.[4] Respondents were financially rewarded for their participation. In both countries, a subsample was reassessed after approximately three to four weeks (MdnUK = 28 days; MdnDE = 20 days).
Only respondents who completed the full questionnaire - that is, who did not abort the survey prematurely - were included in our analyses. To handle missing values on single items, we used full information maximum likelihood estimation (FIML) in our analyses. This yielded gross samples of NUK = 508 and NDE = 513, respectively. In the next step, invalid cases were excluded based on (a) ipsatized variance, that is, the within-person variance across items (Kemper & Menold, 2014), if the person fell within the lower 5% of the sample distribution of ipsatized variance; (b) the Mahalanobis distance of a person's response vector from the average sample response vector (Meade & Craig, 2012) if he/she fell within the upper 2.5% of the sample distribution of the Mahalanobis distance; and (c) response time if the person took, on average, less than 1 s respond to an item. Our intention in choosing relatively liberal cutoff values was to avoid accidentally excluding valid cases and thereby creating a systematic bias in our data. The outlined approach resulted in total exclusion of 7.9% of cases in the UK subsample and 7.6% of cases in the DE subsample, yielding net sample sizes of NUK = 468 (retest: NUK = 111) and NDE = 474 (retest: NDE = 117), respectively. Table 2 depicts in detail the sample characteristic features and distribution.
Table 2
Sample Characteristic Features
|
|
United Kingdom |
Germany |
|
N |
468 |
474 |
|
Mean age in years (SD) [Range] |
45.2 (14.5) [18-69] |
44.0 (14.4) [18-69] |
|
Proportion of women (%) |
52.6 |
50.0 |
|
Educational level (%) |
|
|
|
Low: never went to school, skills for life/1-4 GCSEs A*-C or equivalent |
34.8 |
33.5 |
|
Middle: 5 or more GCSEs A*-C/vocational GCSE/GNVQ intermediate or equivalent |
32.1 |
33.8 |
|
High: 2 or more A-levels or equivalent |
33.1 |
32.7 |
Note. The equivalent German educational levels were as follows (from low to high): ohne Bildungsabschluss/Hauptschule [no educational qualification; lower secondary leaving certificate], mittlerer Schulabschluss [intermediate school leaving certificate], (Fach-)Hochschulreife [higher education entrance qualification].
Material
The online survey was conducted in German for the German sample and in English for the UK sample. It comprised the respective language versions of the KSE-G. In addition to administering the KSE-G, a set of sociodemographic variables (gender, age, highest level of education, income, and employment status) was assessed. To validate the KSE-G against the Big Five dimensions of personality, a short scale measure of the Big Five, the extra-short form of the Big Five Inventory-2 (BFI-2-XS; English version: Soto & John, 2017; German version: Rammstedt, Danner, Soto, & John, 2018), was also administered as part of the survey.[5]
Item analyses
We first investigated the factorial structure of the KSE-G in the UK and DE in two separate CFAs. As the fit indices proved to be acceptable to good[6], we subsequently conducted multi-group confirmatory factor analysis (MG-CFA) using a two-dimensional measurement model developed for Germany by Kemper et al. (2014) with two intercorrelated latent factors capturing PQ+ and NQ−. In both countries, factor loadings and item intercepts were freely estimated, whereas the variance of the latent PQ+ and NQ− factor was set to 1. We used robust maximum likelihood estimation (MLR). The model is plotted in Figure 1; its fit indices suggest an acceptable to good model fit (Hu & Bentler, 1999; Schermelleh-Engel, Moosbrugger, & Müller, 2003; Schweizer, 2010). The fit indices refer to the commonly used MLR-scaled RMSEA and CFI indices, which - strictly speaking - only apply to populations: χ²(16) = 58.032 (UK: χ² = 33.014; DE: χ² = 25.017), p < .001, CFI = .956, RMSEA = .075, SRMR = .049.[7] The size of the items' factor loadings confirms the two-dimensional measurement model, too (see Figure 1).
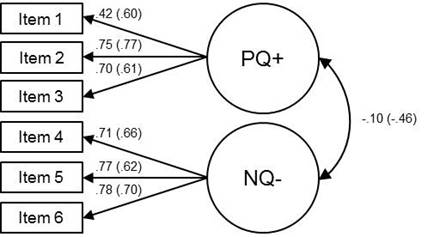
Figure 1. Two-dimensional measurement model of the KSE-G with standardized coefficients. The coefficients of the German sample are in parentheses. NUK = 468; NDE = 474. PQ+ = exaggerating positive qualities; NQ− = minimizing negative qualities.
Item parameters
Table 3 shows the means, standard deviations, skewness, and kurtosis for the six items, as well as reliability coefficients for both subscales of the KSE-G separately for the English and German samples.
Table 3
Descriptive Statistics for KSE-G Items and Subscales
|
|
M |
SD |
Skewness |
Kurtosis |
α |
ω |
rtt |
|||||||
|
Item |
UK |
DE |
UK |
DE |
UK |
DE |
UK |
DE |
UK |
DE |
UK |
DE |
UK |
DE |
|
PQ+ |
3.55 |
3.67 |
0.73 |
0.68 |
−0.23 |
−0.20 |
−0.13 |
−0.36 |
.65 |
.70 |
.67 |
.70 |
.64 |
.72 |
|
1 |
3.40 |
3.46 |
0.93 |
0.89 |
−0.28 |
−0.31 |
−0.47 |
−0.32 |
|
|
|
|
|
|
|
2 |
3.47 |
3.57 |
1.05 |
0.89 |
−0.42 |
−0.20 |
−0.52 |
−0.54 |
|
|
|
|
|
|
|
3 |
3.77 |
3.96 |
0.88 |
0.81 |
−0.37 |
−0.54 |
−0.45 |
0.04 |
|
|
|
|
|
|
|
NQ− |
1.90 |
2.12 |
0.93 |
0.89 |
1.29 |
0.87 |
1.07 |
0.48 |
.79 |
.69 |
.79 |
.69 |
.64 |
.67 |
|
4 |
2.25 |
2.30 |
1.19 |
1.09 |
0.75 |
0.56 |
−0.32 |
−0.46 |
|
|
|
|
|
|
|
5 |
1.76 |
2.11 |
1.10 |
1.25 |
1.44 |
0.85 |
1.22 |
−0.48 |
|
|
|
|
|
|
|
6 |
1.69 |
1.94 |
1.04 |
1.04 |
1.46 |
1.03 |
1.23 |
0.47 |
|
|
|
|
|
|
Note. UK = United Kingdom (N = 468; retest: N = 111); DE = Germany (N = 474; retest: N = 117). PQ+ = exaggerating positive qualities; NQ− = minimizing negative qualities. The time interval between test and retest ranged between three to four weeks (MdnUK = 28 days; MdnDE = 20 days).
[4] The information on the research goal is not included in the original publication.
[5] As the KSE-G was administered as part of a comprehensive online survey for the validation of various scales, there was no room for further validation scales of similar SDR constructs, of constructs that are related but conceptually distinct from SDR, and of constructs that distinguish the two subscales of the KSE-G. However, there are already enough indications of construct validity for the German source scale (see Kemper et al., 2014).
[6] UK-χ²(8) = 25.786, p < .01, CFI = .965, RMSEA = .069, SRMR = .050; DE-χ²(8) = 32.059, p < .001, CFI = .947, RMSEA = .080, SRMR = .048.
[7] Taking the sample size into account prevents biased fit indices, yielding so-called robust CFI and robust RMSEA values in R/lavaan (Brosseau-Liard, Savalei, & Li, 2012; Brosseau-Liard & Savalei, 2014): robust CFI = .963, robust RMSEA = .077.
To validate the English adaptation of the KSE-G, and to investigate its comparability with the German source version, we analyzed psychometric criteria - more precisely, reliability and validity - in both language versions. Moreover, we assessed test fairness across both countries via measurement invariance tests. The statistical analysis was run with R.
Objectivity[8]
The standardized questionnaire format and written instructions, the fixed scoring rules and labeled categories, and the reference ranges ensured the objectivity of application, evaluation, and interpretation of the KSE-G.
Reliability
As estimates for the reliability of the KSE-G, we computed Cronbach's alpha (Cronbach, 1951), McDonald's omega (McDonald, 1999; Raykov, 1997), and the test-retest stability for the two subscales PQ+ and NQ−. The rationale for using these measures was twofold. First, we wanted to provide information on the most commonly used reliability estimate, namely Cronbach's alpha, even though the appropriateness of this measure of internal consistency is limited in the case of ultra-short scales, in which items are selected to reflect the bandwidth of the underlying dimension (i.e., its heterogeneity but not its homogeneity). Second, we report McDonald's omega, as a more appropriate measure in the current context, because we specified a tau-congeneric model, and each subscale consists of only three items.
The reliability estimates (see Table 3) ranged between .65 and .67 (UK) and between .70 and .72 (DE) for PQ+ and between .64 and .79 (UK) and between .67 and .69 (DE) for NQ−, which can be deemed sufficient for research purposes (Aiken & Groth-Marnat, 2006; Kemper, Trapp, Kathmann, Samuel, & Ziegler, 2018). In detail, PQ+ proved to be more reliable in Germany than in the UK, whereas NQ− showed even better reliability estimates in the UK than in Germany (except in the case of test-retest stability). As internal consistency estimates vary across groups, test-retest correlations are recommended for a comparison of the reliability of scale scores.
Validity
Besides content-related validity, which was ensured by Kemper et al. (2014) within the original scale development process, we investigated two types of validity: factorial validity and construct validity. Content-related validity "refers to the degree to which the test content elicits behaviors that are representative of the universe of construct-related behaviors the test is designed to measure" (Kemper, 2017, p. 1). Factorial validity is "the validity of a test determined by its correlation with a factor [...] determined by factor analysis" (Colman, 2009). Construct validity is "the degree to which a test measures what it claims, or purports, to be measuring" (Brown, 1996, p. 231).
The dimensionality of the construct and the size of the items' factor loadings (see Figure 1) indicate the factorial validity of the scale.
Convergent and discriminant construct validity was computed based on manifest correlations. The correlation coefficients are depicted in Table 4; their interpretation is based on Cohen (1992): small effect (r ≥ .10), medium effect (r ≥ .30), and strong effect (r ≥ .50). Due to alpha accumulation through multiple testing, only coefficients with a significance level above p < .001 are interpreted (this is the threshold after Bonferroni adjustment - we use adjusted significance levels only to decide which significant correlations should be used for interpretation; Table 4 displays unadjusted p-values). Before computing the correlations, we recoded the items of NQ−. Hence, high scores on PQ+ are tantamount to high scores on NQ−, implying high SDR. In order to investigate both types of construct validity by examining whether an underlying moralistic bias in answering personality items existed, we correlated the two subscales of the KSE-G with the Big Five traits, Extraversion, Agreeableness, Conscientiousness, Emotional Stability, and Openness, assessed with the BFI-2-XS (Rammstedt et al., 2018; Soto & John, 2017). The results (see Table 4) support our expectations: For both countries, and for both subdimensions, the strongest associations were found for Agreeableness, followed by Conscientiousness. Stable across the two countries, we found also substantial associations of PQ+ with Emotional Stability and Openness. Small or zero effects were found for Extraversion. In sum, the pattern of correlations confirms construct validity and points toward a moralistic bias in the respondents' answers.
Furthermore, we calculated correlations between the two Gamma factors of the KSE-G and relevant sociodemographic variables, namely employment status, income, educational level, age, and gender. Only little evidence exists to date on sociodemographic and socioeconomic correlates of SDR. In their initial validation study of the German KSE-G, Kemper et al. (2014) reported a small positive association between age and PQ+, a medium positive association between age and NQ−, and a small positive association between gender and NQ−. The present analyses partly support these associations both for the German source version and its English adaptation. There were small to medium correlations between NQ− and employment status (UK only), age, and gender. Individuals with a high employment status, and elderly individuals, had a greater tendency to minimize negative qualities. Men were less likely to minimize negative qualities than women. There were no associations between educational level and either PQ+ or NQ− and no reportable associations between all sociodemographic variables and PQ+.
Table 4
Correlations of the KSE-G with Relevant Variables
|
|
PQ+ |
NQ− |
||
|
|
UK |
DE |
UK |
DE |
|
Big Five |
|
|
|
|
|
Extraversion |
.13** |
.04 |
−.13** |
−.03 |
|
Agreeableness |
.38*** |
.41*** |
.31*** |
.35*** |
|
Conscientiousness |
.20*** |
.37*** |
.29*** |
.26*** |
|
Emotional Stability |
.30*** |
.31*** |
.08 |
.12** |
|
Openness |
.21*** |
.25*** |
−.01 |
.09 |
|
Employment status |
.11* |
.04 |
.20*** |
.10* |
|
Income |
.05 |
.07 |
−.16** |
.01 |
|
Educational level |
.04 |
.05 |
−.06 |
−.07 |
|
Age |
.09* |
.11* |
.27*** |
.33*** |
|
Gender |
−.04 |
.05 |
.21*** |
.18*** |
Note. UK = United Kingdom (N = 468; NEmployment status = 450; NIncome = 431); DE = Germany (N = 474; NEmployment status = 462; NIncome = 449). PQ+ = exaggerating positive qualities; NQ− = minimizing negative qualities. Gender: 1 = male, 2 = female. *p < .05, **p < .01, ***p < .001. Coefficients significant on the p < .001 level are set in boldface.
Descriptive statistics
Table 5 indicates the reference ranges in terms of means, standard deviations, skewness, and kurtosis of the two subscales of the KSE-G for the total population, as well as separately for gender and age groups. Standard values are not available.
Table 5
Reference Ranges of the KSE-G for the Total Population and for Gender and Age Groups
|
|
M |
SD |
Skewness |
Kurtosis |
||||
|
|
UK |
DE |
UK |
DE |
UK |
DE |
UK |
DE |
|
|
|
|
|
|
|
|
|
|
|
PQ+ |
3.55 |
3.67 |
0.73 |
0.68 |
−0.23 |
−0.20 |
−0.13 |
−0.36 |
|
NQ− |
1.90 |
2.12 |
0.93 |
0.89 |
1.29 |
0.87 |
1.07 |
0.48 |
|
|
|
|
|
|
|
|
|
|
|
PQ+ |
|
|
|
|
|
|
|
|
|
Male [nUK = 222; nDE = 237] |
3.58 |
3.63 |
0.70 |
0.67 |
−0.26 |
−0.13 |
−0.30 |
−0.29 |
|
Female [nUK = 246; nDE = 237] |
3.52 |
3.70 |
0.76 |
0.69 |
−0.20 |
−0.28 |
−0.07 |
−0.42 |
|
NQ− |
|
|
|
|
|
|
|
|
|
Male [nUK = 222; nDE = 237] |
2.11 |
2.28 |
0.96 |
0.91 |
0.97 |
0.73 |
0.23 |
0.10 |
|
Female [nUK = 246; nDE = 237] |
1.71 |
1.96 |
0.86 |
0.84 |
1.72 |
1.05 |
2.65 |
1.10 |
|
|
|
|
|
|
|
|
|
|
|
PQ+ |
|
|
|
|
|
|
|
|
|
18−29 [nUK = 104; nDE = 105] |
3.41 |
3.58 |
0.68 |
0.72 |
−0.28 |
−0.29 |
−0.08 |
−0.54 |
|
30−49 [nUK = 180; nDE = 191] |
3.56 |
3.64 |
0.76 |
0.67 |
−0.25 |
−0.11 |
−0.08 |
−0.45 |
|
50−69 [nUK = 184; nDE = 178] |
3.62 |
3.74 |
0.73 |
0.66 |
−0.24 |
−0.20 |
−0.31 |
−0.29 |
|
NQ− |
|
|
|
|
|
|
|
|
|
18−29 [nUK = 104; nDE = 105] |
2.26 |
2.54 |
0.97 |
0.90 |
0.80 |
0.46 |
−0.08 |
−0.16 |
|
30−49 [nUK = 180; nDE = 191] |
1.99 |
2.18 |
1.02 |
0.94 |
1.11 |
0.91 |
0.31 |
0.54 |
|
50−69 [nUK = 184; nDE = 178] |
1.61 |
1.80 |
0.71 |
0.70 |
1.94 |
0.90 |
4.56 |
0.30 |
Note. UK = United Kingdom (N = 468); DE = Germany (N = 474). PQ+ = exaggerating positive qualities; NQ− = minimizing negative qualities.
Further quality criteria
Due to its short completion time (< 1 min), the instrument can be seen as economic.
We assessed test fairness across countries via measurement invariance tests with MG-CFA (Vandenberg & Lance, 2000; Widaman & Reise, 1997). In order to determine the level of measurement invariance, we used the cutoff values recommended by Chen (2007). According to these benchmarks, SRMR as well as MLR-scaled CFI and RMSEA indicate metric measurement invariance of the two subscales across the United Kingdom and Germany, implying comparability of correlations based on the latent factors between both countries (configural model: CFI = .956, RMSEA = .075, SRMR = .049; metric model: CFI = .951, RMSEA = .071, SRMR = .052; scalar model: CFI = .935, RMSEA = .074, SRMR = .056).[9]
Further literature
The scale was first published in the journal Measurement Instruments for the Social Sciences.
Acknowledgement
The study was funded by an internal grant provided by GESIS - Leibniz Institute for the Social Sciences.
[8] The information on objectivity is not included in the original publication.
[9] Robust CFI and robust RMSEA are as follows: configural model-robust CFI = .963, robust RMSEA = .077; metric model-robust CFI = .958, robust RMSEA = .074; scalar model-robust CFI = .945, robust RMSEA = .077.
Nießen, D., Partsch, M. V., Kemper, C. J., & Rammstedt, B.