
Short Form Cultural Intelligence Scale (SFCQ)
- Measurement Instrument
- Documentation
- Cite
- Terms of use
- Standard License
- For use for other purposes contact the authors
Instruction
Below are 10 statements about one’s experience when interacting with people from other cultures. Please indicate to what extent each of the following statements describes you.
Items
|
No. |
Item |
Facet |
|
1 |
I know the ways in which cultures around the world are different. |
K |
|
2 |
I can give examples of cultural differences from my personal experience, reading, and so on. |
K |
|
3 |
I enjoy talking with people from different cultures. |
S |
|
4 |
I have the ability to accurately understand the feelings of people from other cultures. |
S |
|
5 |
I sometimes try to understand people from another culture by imagining how something looks from their perspective. |
S |
|
6 |
I can change my behavior to suit different cultural situations and people. |
S |
|
7 |
I accept delays without becoming upset when in different cultural situations and with culturally different people. |
S |
|
8 |
I am aware of the cultural knowledge I use when interacting with someone from another culture. |
M |
|
9 |
I think a lot about the influence that culture has on my behavior and that of others who are culturally different. |
M |
|
10 |
I am aware that I need to plan my course of action when in different cultural situations and with culturally different people. |
M |
K = Knowledge Item; S = Skill Item; M = Metacognition Item
All items are presented in fixed order.
Response specifications
1 = Not at all; 2 = A little; 3 = Somewhat; 4 = A lot; 5 = Extremely well
Scoring
Arithmetic average of 10 items. All items are keyed in the same direction. Higher scores indicate higher cultural intelligence.
Application field
Numerous implications result from being able to measure cultural intelligence as originally conceptualized. Researchers can assess and accurately reflect on the influence of the overall construct of cultural intelligence on outcomes as opposed to being relegated to a discussion of one or more subordinate facets. The potentially confounding effect of motivation to interact with culturally different others as opposed to the capability to do so is eliminated from the equation. Motivation can then be properly treated as a separate element in cross-cultural studies. In so doing, the potentially interacting effects of the motivation to engage in intercultural interaction and the ability to do so can be unbundled. The brevity and ease of administration of the SFCQ scale suggest a wide range of human resource management applications, especially with regard to training and development. Individuals considering work that involves high levels of cross-cultural interaction might find the instrument useful as a self-assessment and as a developmental tool related to their career aspirations. As organizations increasingly face a knowledge-based competitive environment, the human aspect of management becomes paramount. In international management this means understanding the effect of cultural differences on management behavior. An important aspect of this endeavor is understanding variation in the ability of individuals to deal effectively with the cultural aspects of their environment. Cultural intelligence helps us explain the variation we observe in cross-cultural effectiveness among individuals who are otherwise intelligent, emotionally mature, and seem to have good social skills.
Cultural intelligence (CQ) is a multifaceted culture general form of intelligence that is related to effective intercultural interactions (Thomas et al., 2008). Defining this construct as a type of intelligence as opposed to intercultural competence or any number of similar terms has two advantages. It substitutes well-studied ideas in cognitive psychology for the more popular, but less well specified, concepts such as global mindset that have made their way into the management literature. In addition it clearly separates this individual difference construct from institutional and environmental influences on intercultural effectiveness.
Intelligence is commonly defined as the abilities necessary for adaptation to an environmental context (Binet & Simon, 1916; Sternberg, 1997; Wechsler, 1939). Cultural intelligence is this ability as applied to a specific aspect of the environmental context – the cultural context. Consistent with contemporary views of intelligence, we define cultural intelligence as multifaceted (see Gardner, 1985; Sternberg, Lautrey, & Lubart, 2003) and as a unique construction of abilities that exists outside the cultural boundaries in which these abilities are developed. Cultural intelligence consists of knowledge and skills, developed in specific cultural (intercultural) contexts, but is dependent on the culture general process of cultural metacognition to produce culturally intelligent behavior (Thomas et al., 2012). The measurement requires an assessment of each of these three facets. However, cultural intelligence is theorized to be a latent construct, which is in turn reflected in three facets of cultural knowledge, cross-cultural skills, and cultural metacognition. As in general intelligence, cultural intelligence is theorized to be a reflective model where the underlying construct of cultural intelligence is indicated in the measure as opposed to a formative model in which the latent construct is an index composed of the measures. In this case, cultural intelligence is an indirect reflective model (see Edwards & Bagozzi, 2000) because of the multiple mediating constructs of cultural knowledge, cross-cultural skills, and cultural metacognition.
Item generation and selection
An original instrument created to capture the construct on cultural intelligence involved a matrix of assessment approaches contained in an online delivery system (see Thomas et al., 2012). This measure was sophisticated (employing concurrent cognitive process tracing using verbal protocol, for example) and demonstrated good reliability and validity. However, both administration and coding was very complex, which has limited its acceptance and utility. Therefore based on our theory of cultural intelligence and guided by the initial instrument development, we extracted the key elements of the measure of each facet of cultural intelligence to form a 10-item scale consisting of measures of the three constituent elements of cultural knowledge, cultural skills, and cultural metacognition (English-language version of the short form cultural intelligence (SFCQ) scale shown here). In support of the content validity of the scale the wording of specific items was created by an international panel of experts in cross-cultural management to best represent each overall facet. The scale was translated and back translated (Brislin, 1970) into five languages, the equivalence of which was tested.
Cultural knowledge is measured with two items (No. 1-2) that assess knowledge of the ways in which cultures vary and also the complexity of that knowledge (K). Complexity is measured indirectly by asking respondents the extent to which they can give examples of cultural differences. Previous instrument development (Thomas et al., 2012) indicated the ability to relate stories of cultural variation was indicative of more complex thinking in this regard. Each of the five cultural skill dimensions (S) of relational skills, perceptual acuity, empathy, adaptability, and tolerance of uncertainty are represented by one item (No. 3-7). Finally, the three facets of cultural metacognition (M) of awareness of cultural differences, analysis of cultural differences, and planning a course of action with culturally different people are measured by one item each (No. 8-10).
Samples
We collected data from 3526 participants in 14 samples around the world. Since we theorized cultural intelligence to be a culture-independent construct, we recruited participants in a variety of cultures and with a wide range of demographic characteristics in order to better generalize from the results. The survey was conducted in five languages – English, French, Indonesian, Turkish, and traditional Chinese. Additional information about each sample, including sample size, language in which the survey was administrated, age, gender, number of countries of birth, is reported in Table 1. Data were collected at different points in time and samples are numbered based on the time sequence.
Table 1
Characteristics of samples
|
Sample |
Country Data Collected |
N |
Language Survey Administrated |
Demographics |
Age Mean (SD) |
Gender (% Males) |
Number of Countries of Birth |
Variables |
|
1 |
US |
499 |
English |
General population |
31.38 (10.44) |
59.7% |
19 |
- |
|
2 |
India |
109 |
English |
General population |
30.47 (9.91) |
68.8% |
3 |
- |
|
3 |
France |
359 |
English (N = 53) |
Employees |
36.71 (10.36) |
38.7% |
25 |
- |
|
4 |
Australia |
59 |
English |
MBAs |
34.90 (5.80) |
61.0% |
18 |
- |
|
5 |
Australia & Indonesia |
1120 |
English (N = 699) |
Students and respective family members |
26.92 (12.03) |
42.3% |
47 |
demographics (age, gender, and country of birth only) |
|
6 |
Australia |
162 |
English (N = 70) Indonesian (N = 92) |
Migrants |
34.99 (9.04) |
48.8% |
5 |
sociocultural acculturation and adaptation |
|
7 |
Australia |
229 |
English |
International Students |
22.89 (2.92) |
35.8% |
30 |
sociocultural acculturation and adaptation |
|
8 |
Turkey |
153 |
Turkish |
Employees |
31.65 (9.80) |
52.3% |
3 |
EQ, Personality, Intercultural Effectiveness, Ethnocentrism |
|
9 |
HK |
243 |
Traditional Chinese |
University Alumni and Mall Customers |
31.92 (13.29) |
32.5% (missing = 24.7%) |
4 |
EQ, Personality, Intercultural Effectiveness, Ethnocentrism |
|
10 |
Multiple countries |
142 |
English |
Students |
22.31 (2.16) |
37.3% |
22 |
EQ, Personality, Intercultural Effectiveness, Ethnocentrism |
|
11 |
France |
211 |
English (N = 21) French (N = 190) |
Employees |
39.57 (9.76) |
46.9% |
27 |
EQ, Personality, Intercultural Effectiveness, Ethnocentrism, Job Performance |
|
12 |
US |
56 |
English |
Part time MBAs |
31.60 (7.40) |
62.5% |
7 |
EQ, Personality, Intercultural Effectiveness, Ethnocentrism, Job Performance |
|
13 |
US |
72 |
English |
General population |
37.55 (11.22) |
36.1% |
3 |
EQ, Personality, Intercultural Effectiveness, Ethnocentrism |
|
14 |
Multiple countries |
112 |
English |
General population |
33.08 (10.10) |
53.6% |
13 |
EQ, Conscientiousness, Job Performance, Attribution |
|
Total |
|
3526 |
|
|
|
|
|
|
Item analyses
To examine construct validity of the SFCQ measure we conducted a CFA using EQS 6.0 software package (Bentler, 2008) with maximum likelihood estimation and mean structure analysis to compare a one-factor model vs a theoretically based model with one second-order factor (CQ) and three first-order factors (knowledge, skills, metacognition) using data from Sample 1, N = 499. A graphic representation of the second-order factor structure is shown in Figure 1.
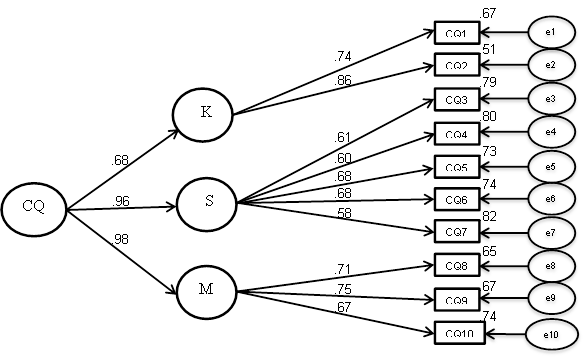
Figure 1. Indirect reflective factor structure of SFCQ (K = Knowledge, S = Skills, M = Metacognition). Error terms for the first-order factors not shown. Paths represent standardized loadings, the other numbers reflect standardized error variances.
A good model fit is indicated by a non-significant c2 test, but since c2 is sensitive to a large sample size, we also considered other recommended model fit indices to evaluate model fit, including standardized root mean square residual (SRMR), root mean square error of approximation (RMSEA), Non-Normed Fit Index (NNFI), and Comparative Fit Index (CFI). A good model fit is indicated by SRMR lower than 0.08, RMSEA lower than 0.06, and other indices higher than .95 (Hu & Bentler, 1998, 1999). The one-factor structure yielded poor model fit, with c2 (35) = 263.48, p < .01, NNFI = .84, CFI = .86, SRMR = .06, RMSEA = .11, 90%-CI = (.10, .13). In contrast, the second-order factor structure yielded good model fit, with c2 (32) = 127.67, p < .01, NNFI = .93, CFI = .95, SRMR = .04, RMSEA = .08, 90%-CI = (.06, .09). All items significantly loaded on the expected factors and the factor loadings ranged from .58 to .86. Data fit the theoretically driven second-order factor structure confirming the construct validity of the measure. A vanishing tetrad test (Bollen & Ting, 2000; Hipp, Bauer, & Bollen, 2005; Ting, 1995) supported the reflective structure of the construct.
Equivalence
Fundamental to equivalence of a culture-independent construct is that the scale functions in a similar manner in different languages. To test if the English-language SFCQ scale had been translated appropriately, we examined its equivalence across five language groups (English, French, Indonesian, Turkish, and traditional Chinese) by conducting a likelihood ratio test (Bollen, 1989) with multi-group CFA (Little, 1997) using data from all samples N = 3526 (English = 2091, French = 496, Indonesian = 543, Turkish = 153, traditional Chinese = 243). We examined a configural model, a metric invariance model with equality constraints on the factor loadings between the observed variables and their respective first-order factors across the five language groups, and a final metric invariance model with constraints on the factor loadings as well as paths between the second-order factor and the three first-order factors. All three models yielded good model fit, and c2-difference tests indicated that the final metric invariance model fit did not significantly deteriorate from the less restrictive models. The analyses supported metric (but not scalar) invariance across the five language groups and indicated that the relationships between the items in the SFCQ scale and the three first-order factors, as well as the relationships between the second-order CQ factor and the three first-order factors are equivalent across the five language versions. These results also lend support to the accurate translation of the scale. Mean CQ differences were not compared across cultures. See Table 2.
Table 2
Model fit indices and chi-square difference tests of measurement equivalence
|
Model |
c2 (df) |
Δc2 (Δdf) |
NNFI |
CFI |
SRMR |
RMSEA (90%-CI) |
|
Configural |
649.94 (160)** |
- |
.95 |
.96 |
.04 |
.030 (.027, .032)
|
|
Metric invariance (factor loadings only) |
689.64 (188)** |
39.70 (28) |
.95 |
.96 |
.05 |
.028 (.025, .030) |
|
Final metric invariance (factor loadings and paths) |
701.47 (196)** |
11.83 (8) |
.96 |
.96 |
.05 |
.027 (.025, .029) |
Note. ** = p < .01. Δc2 is sensitive to sample size (Brannick, 1995; Kelloway, 1995). Because of this limitation, researchers such as Cheung and Rensvold (2002) have recommended the use of ΔCFI. If the reduction in the value of CFI is smaller or equal to .01 in the constrained model, then it is suggested that the constrained model does not deteriorate from the original model. In our case, CFI remained .96 across all models, which indicated the final metric equivalence model with constraints on both factor loadings and paths between the second-order factor and the three first-order factors is accepted.
Reliability
Across the 14 samples, all internal consistency reliability estimates as measured by Cronbach’s α were above .77 with an average reliability of .85 (see Table 3). Yet Cronbach’s α is merely an estimate of the lower bound of internal consistency reliability, and the SFCQ represents a hierarchical construct, which violates α’s assumption of an essentially tau-equivalent, unidimensional measurement model (McDonald, 1999; Reise, Bonfay, Haviland, 2013; Zinbarg, Revelle, Yovel, & Li, 2005). Therefore scale composite reliability (omega-h) was estimated as the total score variance that can be attributed to the general factor CQ (McDonald, 1999; Raykov & Marcoulides, 2012), Ωh = .93 (estimated on the basis of standardized CFA parameters from Sample 1; cf. Fig.1). The subscale reliabilites amounted to Ω = .76, .90, and .83 for Knowledge, Skills, and Metacognition, respectively.
Table 3
Means, standard deviations and reliabilities of SFCQ scale across samples
|
Sample |
Country Data Collected |
N |
M |
SD |
Cronbach’s Alpha |
|
1 |
US |
499 |
3.32 |
0.65 |
.87 |
|
2 |
India |
109 |
3.61 |
0.56 |
.85 |
|
3 |
France |
359 |
3.78 |
0.58 |
.86 |
|
4 |
Australia |
59 |
3.43 |
0.43 |
.77 |
|
5 |
Australia & Indonesia |
1120 |
3.40 |
0.66 |
.90 |
|
6 |
Australia |
162 |
3.49 |
0.50 |
.82 |
|
7 |
Australia |
229 |
3.59 |
0.65 |
.91 |
|
8 |
Turkey |
153 |
3.70 |
0.50 |
.82 |
|
9 |
HK |
243 |
3.39 |
0.55 |
.85 |
|
10 |
Multiple countries |
142 |
3.58 |
0.51 |
.78 |
|
11 |
France |
211 |
3.85 |
0.52 |
.83 |
|
12 |
US |
56 |
3.67 |
0.52 |
.83 |
|
13 |
US |
72 |
3.24 |
0.68 |
.90 |
|
14 |
Multiple countries |
112 |
3.65 |
0.61 |
.87 |
|
|
|
|
|
|
|
|
|
Total |
3526 |
3.51 |
0.63 |
.88 |
|
|
Average |
|
3.55 |
0.57 |
.85 |
Validity
To construct a nomological net we evaluated the relationship of the SFCQ scale with Emotional Intelligence (EI scale from Wong & Law, 2002), personality (Big Five with the International Personality Inventory from Goldberg, 1992), ethnocentrism (with the Generalized Ethnocentrism Scale from Neuliep, 2002; Neuliep & McCroskey, 1997), and indicators of multicultural experience (number of languages spoken, number of countries lived in, number countries visited, having parents born in a different country). Correlations based on the composite score of each variable are presented in Table 4.
Table 4
Correlations between SFCQ, EQ, personality, and multicultural experience
|
|
|
N |
M |
SD |
1 |
2 |
3 |
4 |
5 |
6 |
7 |
8 |
9 |
10 |
|
1 |
SFCQ |
2405 |
3.51 |
0.63 |
(.88) |
|
|
|
|
|
|
|
|
|
|
2 |
EQ |
885 |
3.76 |
0.52 |
.44** |
(.88) |
|
|
|
|
|
|
|
|
|
3 |
Extraversion |
875 |
3.27 |
0.73 |
.35** |
.35** |
(.88) |
|
|
|
|
|
|
|
|
4 |
Agreeableness |
875 |
3.82 |
0.52 |
.38** |
.51** |
.40** |
(.78) |
|
|
|
|
|
|
|
5 |
Conscientiousness |
987 |
3.68 |
0.62 |
.17** |
.45** |
.06 |
.26** |
(.81) |
|
|
|
|
|
|
6 |
Neuroticism |
875 |
3.26 |
0.76 |
-.17** |
-.38** |
-.24** |
-.15** |
-.19** |
(.87) |
|
|
|
|
|
7 |
Openness |
875 |
3.64 |
0.58 |
.40** |
.44** |
.35** |
.41** |
.25** |
-.12** |
(.81) |
|
|
|
|
8 |
Ethnocentrism |
850 |
28.84 |
8.71 |
-.33** |
-.16** |
-.15** |
-.37** |
-.20** |
.26** |
-.31** |
(.90) |
|
|
|
9 |
# languages spoken |
2391 |
2.40 |
1.00 |
.29** |
-.02** |
.15** |
-.09** |
-.02** |
.05** |
-.01... |
-.02" |
- |
|
|
10 |
# countries lived in |
2371 |
1.40 |
0.60 |
.26** |
.10** |
.12** |
.06** |
.03** |
-.09** |
.15** |
-.16** |
.29** |
- |
|
11 |
# countries visited |
2385 |
3.70 |
1.47 |
.27** |
.06** |
.23** |
.10** |
.10** |
-.16** |
.20** |
-.26** |
.31** |
.36** |
Note. Numbers in parentheses on the diagonal are coefficient alphas. * = p < .05, ** = p < .01. Correlations of SFCQ with emotional intelligence, personality (except conscientiousness), and ethnocentrism are obtained from Samples 8 – 13 (N = 877), correlation between SFCQ and conscientiousness is obtained from Samples 8 – 14 (N = 989) and correlations between SFCQ and multicultural experience variables are obtained from all samples except Sample 5 (N = 2406).
As shown in Table 4, the SFCQ scale had a negative and moderate relationship with ethnocentrism and a weak to moderate relationships with EQ and personality traits (correlations ranged from .17 to .44). To demonstrate that SFCQ is distinct from EQ and personality traits, we conducted CFAs with c2-difference test to determine whether the correlations between SFCQ and EQ as well as personality traits are different from 1 (Bagozzi, Yi, & Phillips, 1991). In the first CFA model testing EQ, we freely estimated the correlation between latent factors CQ and EQ. The model yielded good fit, with c2 (291) = 674.29, p < .01, NNFI = .96, CFI = .96, SRMR = .05, RMSEA = .04, 90%-CI = (.04, .04). In the second model, we fixed the correlation between CQ and EQ to 1. c2 significantly increased (Δc2 = 244.30, Δdf = 1, p < .01), indicating the model significantly deteriorated from the first model and that the correlation between the SFCQ scale and EQ was significantly different from 1. Following the same approach we found that the correlations between SFCQ and the five personality traits differed from 1 as well. Although the SFCQ scale was correlated with EQ and some personality traits, these data indicate that they measure different things. This provided initial support for discriminant validity and was consistent with the theoretical underpinnings of cultural intelligence.
We also found evidence to support criterion validity. Indicators of multicultural experience, specifically number of languages spoken, number of countries lived in, and number of countries visited, were all positively correlated with CQ (see Table 4). Also, regarding known-groups validity, a comparison of mean scores on the measure of CQ indicated significantly higher CQ for those individuals who were born in a different country from their parents (Mdiff = 3.69, Msame = 3.54, t = 3.91, p < .01). Taken together these results provide support for the SFCQ scale as a valid measure of cultural intelligence as theorized.
Descriptive statistics
The average mean score across samples was 3.55 with a standard deviation of 0.57. Across the 14 samples, the average item-total correlations ranged from .43 to .63 on the 10 items with a mean of .55. The distribution of the SFCQ score across all samples is presented in Figure 2. This distribution with some very minor deviations follows a normal curve. Based on a Kolmogorov–Smirnov test it is slightly leptokurtic (Kurtosis = 0.29) and has a very small negative skewness (Skewness = −0.23). In large samples, minor deviations from normality are often statistically significant, but often do not deviate enough from normality to make realistic differences in analysis and the visual appearance of the distribution is of greater importance (Tabachnick & Fidell, 1989). Overall, this distribution is what we would expect from an individual difference construct across a large sample of participants.
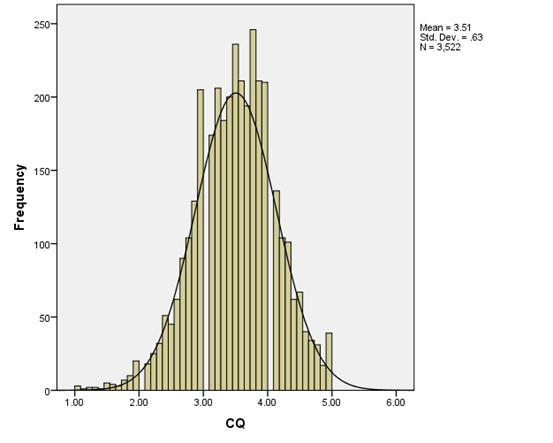
Figure 2. Frequency Distribution of SFCQ Scores.
Further quality criteria
The criterion-related validity of the SFCQ scale was established in various samples with regard to its hypothesized relationships with (a) overall intercultural effectiveness, (b) sociocultural acculturation and adaptation, (c) the ability to develop long-term relationships with culturally different others, (d) the ability to make accurate inter-cultural attributions, and (e) job performance in a culturally diverse environment. Regression coefficients varied between .17 and .33 (see Thomas et al. (2015) for further information).
Translations
The SFCQ is also available in French, Turkish, Indonesian and Chinese. Please contact the first author for details.
David C. Thomas, Segal Graduate School of Business, Simon Fraser University,E-Mail: dcthomas@sfu.ca.