
Interpersonal Trust Short Scale (KUSIV3)
- Measurement Instrument
- Documentation
Instruction
“In the following we are interested in your attitude towards other people. Please indicate the extent to which you agree or disagree with each of the statements below.”
Items
Table 1
Items of the English-Language Adaptation of KUSIV3
|
No. |
Item |
Polarity |
|
1 |
I am convinced that most people have good intentions. |
+ |
|
2 |
You can’t rely on anyone these days. |
– |
|
3 |
In general, people can be trusted. |
+ |
Response specifications
Items are answered using a 5-point rating scale ranging from do not agree at all (1), over hardly agree (2), somewhat agree (3), and mostly agree (4) to completely agree (5).
Scoring
KUSIV3 (Kurzskala Interpersonelles Vertrauen [Interpersonal Trust Short Scale]) consists of three items measuring the construct interpersonal trust. The English-language adaptations of these items are displayed in Table 1 (for the original German-language items, see Beierlein, Kemper, Kovaleva, & Rammstedt, 2014a). As in the German-language source instrument, item 1 and item 3 are positively worded in relation to the underlying construct and item 2 is negatively worded. The negatively keyed item is reverse-scored (6 – raw score), and the unweighted mean score of the three items is computed to obtain an interpersonal trust scale score.[1] In doing so, we treated the ordinal Likert response format as continuous.
Although the measure is, strictly speaking, ordinal in nature, previous studies have shown that such rating scales can be treated as interval, and hence, continuous data without incurring major bias (see also, e.g., Carifio & Perla, 2007; Norman, 2010). Moreover, as the simulation studies conducted by Rhemtulla, Brosseau-Liard, and Savalei (2012) show, the consequences of treating ordinal items as linear (continuous) are typically minor with maximum likelihood estimation producing “estimates within the range of acceptable bias” (p. 370; and it does not make any difference to the findings) when five or more response categories are used, these categories can be assumed to be approximately equidistant, and these variables are approximately normally distributed. In our case, the underlying construct can be seen as continuous (the frequency distribution of the KUSIV3 items and scale score is displayed in Figure 1 and Figure 2 indicating an approximately normally distributed answering distribution) and the distance between the single answering categories as approximately equidistant. We used a maximum likelihood estimator with robust standard errors (MLR) that also accounts for non-normality in the items’ distributions.
|
|
UK |
DE |
|
|
|
|
|
Item 1 |
|
|
|
Item 2 |
|
|
|
Item 3 |
|
|
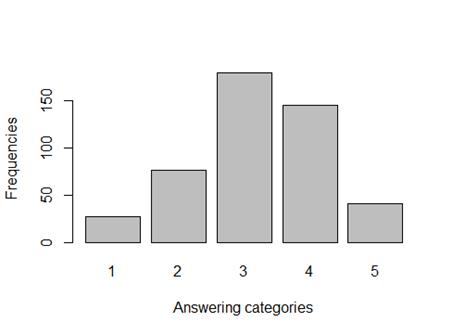
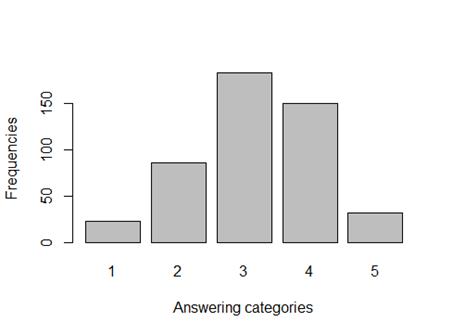
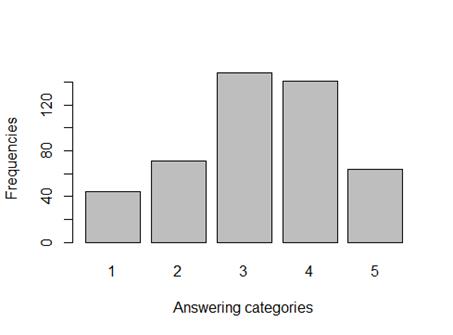
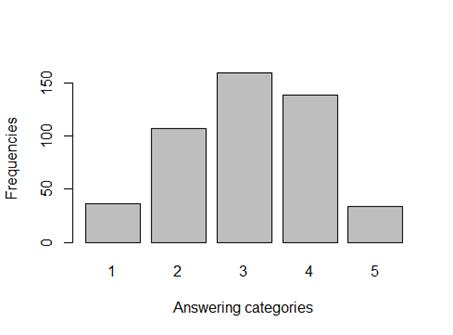
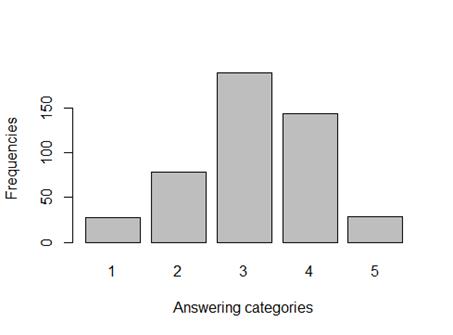
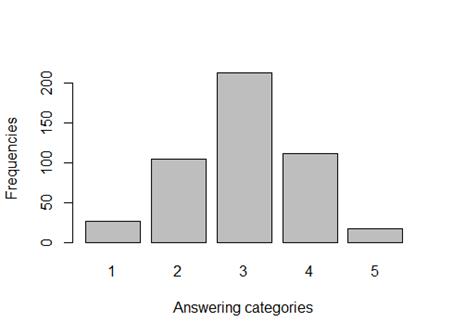
Figure 1. Frequency distribution of the answering categories of the KUSIV3 items. UK = United Kingdom (N = 468); DE = Germany (N = 474).
|
|
UK |
DE |
|
|
|
|
|
Scale score |
|
|
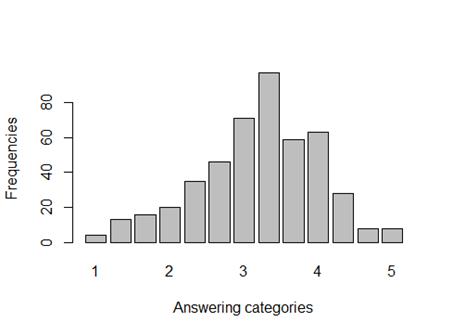
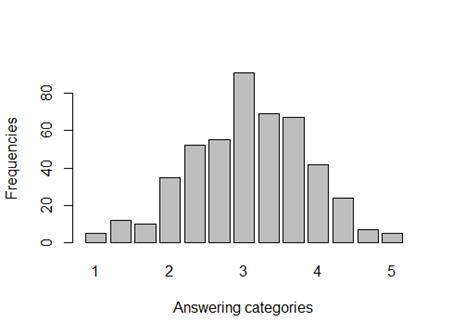
Figure 2. Frequency distribution of the answering categories of the KUSIV3 scale score. UK = United Kingdom (N = 468); DE = Germany (N = 474).
Application field
Interpersonal trust is highly relevant in people’s everyday lives and in contemporary society as a whole. Thus, studies investigating the functioning of social interactions between single individuals need a valid and—especially in research settings with severe time limitations—efficient measure of interpersonal trust. The Interpersonal Trust Short Scale measures interpersonal trust in an economic and time-efficient way. As an ultra-short scale with a completion time of around 30 s, KUSIV3 is applicable in a variety of research areas. It is particularly well suited for research settings in which there are severe time limitations or constraints to questionnaire length. KUSIV3 was originally developed in German (see Beierlein, Kemper, et al., 2014a) and validated in German adults; it was adapted in the present research to English and validated in the United Kingdom. The scale is metrically invariant across the two states and can thus be applied in international assessments to investigate associations between interpersonal trust and other variables across states. KUSIV3 is typically self-administrated, such as via paper-and-pencil or online questionnaire. However, provided slight adaptations to the instructions, an oral administration in a personal interview or telephone interview is also conceivable.
[1] We suggest that individual answers should be aggregated to the scale level only if there are no missing values on any of the three items—a recommendation that is followed in the present study, also with respect to other constructs used for the validation. If there are missing values on one or more items, researchers should use appropriate methods for handling missing data, such as multiple imputation or full information maximum likelihood estimation (see Rose, Wagner, Mayer, & Nagengast, 2019, for an application of maximum likelihood estimation to computing manifest scale scores in a latent variable framework).
Interpersonal trust: Definition and conceptualization
Kasperson, Golding, and Tuler (1992) defined trust “as a person’s expectation that other persons and institutions in a social relationship can be relied upon to act in ways that are competent, predictable, and caring” (p. 169). To trust means to expect positive outcomes even in the absence of hard evidence suggesting that positive outcomes will occur. Trust is commonly viewed as a vital social lubricant for economic transactions, political processes, and social interactions in general. Since the 1980s, the prerequisites and consequences of trust have been the subject of mounting interest among researchers in the fields of social psychology, political sciences, sociology, economics, and communication studies. However, theoretical conceptualizations of trust both within and across disciplines are diverse (Krampen & Hank, 2004). Depending on the research focus, the concept may refer either to the trust placed in others (i.e., interpersonal, which is sometimes called “social trust”), the trust placed in political institutions, officials, or the political system as a whole (i.e., political or institutional trust), or both. Moreover, as we elaborate below, the domain of interpersonal trust also includes a number of different aspects.
During the past 30 years, researchers have demonstrated the predictive value of political and interpersonal trust with regard to such diverse criterion variables as occupational choice, political preferences, outgroup attitudes and discrimination, and political participation and civic involvement (e.g., Wrightsman, 1991). As an essential component of social capital, interpersonal trust is assumed to play a key role in promoting and sustaining viable economies (e.g., Putnam, 1993, 1995). Therefore, several studies have addressed the development of trust in today’s societies over time. For example, recent studies using U.S. data have reported a decline in social trust over the past decades (e.g., Fairbrother & Martin, 2013; Twenge, Campbell, & Carter, 2014).
In his social learning theory of personality, Julian B. Rotter (1971) proposed one of the first and most systematic theoretical descriptions of interpersonal trust, which he defined as “an expectation held by an individual or a group that the word, promise, verbal, or written statement of another individual or group can be relied on” (p. 444). Two types of interpersonal trust are distinguished: generalized trust and limited trust. Generalized trust refers to trust in people who are not known to a person; limited trust refers to trust in persons known to a person, for example, family or friends (OECD, 2017). Because our short scale is dedicated to measuring interpersonal trust in people in general (including strangers but also familiar others), we will use the term “interpersonal trust” in the remainder of this article to denote trust in people who are either known or unknown. We will not explicitly differentiate between generalized and limited trust.
In Krampen’s (2000) action-theory model of personality, trust is defined as the expectation that, in many situations, subjectively pleasant outcomes will occur even without action on the part of the individual. Thus, in Krampen’s model, trust is linked to situation-outcome expectancies—that is, a person’s general expectations that certain events will occur without own action. Viewed as situation-outcome expectancy, interpersonal trust thus refers to the extent to which a person ascribes credibility to other people and expects positive outcomes in the context of social interactions.
Why interpersonal trust matters: Evidence on its correlates
Empirical studies in the social sciences have shown that individual differences in interpersonal trust are systematically related to other variables. For example, interpersonal trust constitutes a resilience factor for mental diseases because it contributes to a person’s physical and psychological well-being and reduces the negative impact of social stress (e.g., Omodei & McLennan, 2000; Takahashi et al., 2005). Furthermore, higher interpersonal trust is associated with a higher level of life and training satisfaction, more optimistic attitudes concerning one’s own life (e.g., Koller, 1992; Schweer, 2006), and a lower tendency toward delinquent behaviors (Putnam, 2000). In addition, higher interpersonal trust is associated with a higher likelihood of accepting work systems in which the supervisor has an influence on the extent of workers’ remuneration (Kopp & Schuler, 2003).
With regard to political involvement, interpersonal trust is positively associated with political participation (Sullivan & Transue, 1999) and social (protest) participation (Benson & Rochon, 2004). Furthermore, trusters are more likely to attend church (Bègue, 2002) and to be members of social and political organizations (Putnam, 2000). Interpersonal trust is also positively correlated with different aspects of political trust, especially to incumbent trust and modestly related to trust in government (e.g., Schiffman, Thelen, & Sherman, 2010). Several studies have provided evidence that interpersonal trust is also an important predictor in the field of behavioral economics. For example, interpersonal trust has been found to promote the willingness to lend money (Fetchenhauer & Dunning, 2009). Additionally, Stadelmann-Steffen and Freitag (2007) found that interpersonal trust promotes economic development in less developed societies.
Finally, the level of interpersonal trust varies among different sociodemographic groups: It decreases with the level of education but increases with age (Krampen, Viebig, & Walter, 1982) and socioeconomic status (Rotter, 1967). Interestingly, and contrary to this, social distrust and social anxiety are positively associated with age and years of education (Krampen et al., 1982). Cross-cultural studies have shown that interpersonal trust is weakly positively associated with individualism (at the collective level) and independent thought and action (at the individual level). For example, Beilmann, Kööts-Ausmees, and Realo (2018) found that “people who emphasize independent thought, action, and readiness to change are also more willing to believe that most people can be trusted and are more engaged in informal social networks” (p. 641). Collectivism is associated with a high prioritization of the group over the self—but this particularly applies to ingroups rather than to outgroups. Therefore, people in collectivist cultures might show a higher level of trust towards relatives and friends, but at the same time, they might endorse a lower level of trust in strangers.
Existing measures of interpersonal trust
Given its increasing relevance in social science research, measures of interpersonal trust are now included in several large-scale national and international social surveys, such as the German Socio-Economic Panel (SOEP), the European Social Survey (ESS), the International Social Survey Programme (ISSP), the British General Household Survey (GHS), the American General Social Survey (GSS), the American National Election Studies (ANES), and the World Values Survey (WVS; e.g., Lundmark, Gilljam, & Dahlberg, 2016).
The specific measures of interpersonal trust vary across these surveys. As Lundmark et al. (2016) noted, in most surveys (e.g., the GSS, the WVS, and ANES) interpersonal trust is assessed using a single, fully balanced question—“Generally speaking, would you say that most people can be trusted or that you need to be very careful in dealing with people?” (p. 26)—accompanied by a dichotomous scale with the alternatives You can’t be too careful (1) and Most people can be trusted (2). In contrast, some surveys (e.g., ESS, SOEP) measure interpersonal trust using between one and three Likert-type items with multiple response categories. Employing a randomized experimental design, Lundmark et al. (2016) compared these different approaches and concluded that interpersonal trust was best measured with multiple response categories rather than a dichotomous scale because “using a several-point scale provides a more valid as well as a more substantively detailed measurement” (p. 40; for general recommendations for measuring attitudes and values, see also Krosnick & Fabrigar, 1997). Survey items measuring interpersonal trust using scales with multiple response categories are often based on earlier measures of interpersonal trust, such as Rotter’s (1967) Interpersonal Trust Scale (ITS). The ITS as a whole or selected items of the ITS have been translated into a number of languages (e.g., a German full version was developed by Amelang, Gold, & Külbel, 1984; single items were translated into Chinese, e.g., Liu, Rau, & Wendler, 2015). The ITS uses a Likert-type scale that comprises 25 negatively and positively poled items tapping, among other dimensions, interpersonal trust. However, there is an ongoing debate on whether or not measurement equivalence can be assumed when using the interpersonal trust measures applied in large-scale social surveys, such as the ESS (see, e.g., Reeskens & Hooghe, 2008; van der Veld & Saris, 2011). Additionally, questions about interpersonal trust may have different meanings in different social groups and, thus, show non-equivalence (Bulloch, 2013). Moreover, some of the existing (short) measures for (generalized) interpersonal trust tap into different aspects of the construct simultaneously without taking into account this potential multidimensionality. For example, the German SOEP-trust scale (Naef & Schupp, 2009) includes one specific item measuring trust in strangers, rather than assessing interpersonal trust as a whole. Thus, these scales may lack conceptual clarity. Hence, there is an unmet need for a conceptually coherent, valid, reliable, and cross-culturally equivalent—yet short and broadly applicable—measure of interpersonal trust. The scale presented in this article aims to meet this need.
Item generation and selection
To develop the German-language source version of KUSIV3, Beierlein, Kemper, et al. (2014a) drew on items from existing social science surveys and interpersonal trust scales, such as SOEP-trust (Naef & Schupp, 2009). Some of these items were linguistically revised. The (revised) items were then tested using exploratory factor analysis (EFA). In the further construction process, the authors discarded items that measured domain-specific rather than interpersonal trust as a whole (for more detailed information, see Beierlein, Kemper, et al., 2014a). The German-language KUSIV3 was thoroughly validated based on a comprehensive sample representative of the adult population in Germany in terms of age, gender, and educational attainment.
Because researchers may be interested in comparing the level of interpersonal trust between different societies, there is a need for a cross-culturally valid measure. To enhance the scope of application of KUSIV3 and to enable social surveys to use KUSIV3 in an English-language context, the scale was adapted to the English language (by Beierlein, Kemper, et al., 2014a) and validated in a sample from the UK (in the present study). First, the three items of KUSIV3 were adapted to English by translating the items following the TRAPD approach (Translation, Review, Adjudication, Pretesting, and Documentation; Harkness, 2003). Two professional translators (English native speakers) translated the instruction, the item wordings, and the response scale labels independently of each other into British English and American English, respectively. During the translation process, none of the translators met any problems or difficulties. Thus, none of the items was flagged as potentially problematic. There were only slight differences in the two separate translation outcomes. Second, an adjudication meeting was held where psychological experts, the two translators, and an expert in questionnaire translation reviewed the various translation proposals and developed the final translation. In collaboration with the team of researchers, the translators quickly came to a consensus and agreed upon an optimal translation of all elements of the scale.
The source instrument by Beierlein et al. (2014a) was developed in and validated for the German language. The aim of the present study was to empirically investigate different types of evidence for the validity of the English-language adaptation of KUSIV3 and to directly compare its psychometric properties with those of the German-language source version.
Samples
To investigate the psychometric properties of the English-language adaptation of KUSIV3, and their comparability with those of the German-language source instrument, we assessed both versions in a web-based survey (using computer-assisted self-administered interviewing [CASI]) conducted in the UK and Germany (DE) by the online access panel provider respondi AG. Fielding took place in January 2018. For both the UK and Germany, quota samples were drawn that represented the heterogeneity of the adult population with regard to age, gender, and educational attainment. Only native speakers of the respective languages were recruited. We explained our research goal (investigation of the quality of several questionnaires) to the participants. Respondents were financially rewarded for their participation. In both states, a subsample was reassessed after approximately 3 to 4 weeks (median time intervals: 28 days in the UK and 20 days in Germany).
Only respondents who completed the full questionnaire—that is, who did not abort the survey prematurely—were included in our analyses. To handle missing values on single items, we used full information maximum likelihood estimation (FIML) in our analyses. The gross sample sizes were NUK = 508 and NDE = 513. In the next step, invalid cases were excluded based on (a) ipsatized variance—that is, the within-person variance across items (Kemper & Menold, 2014)—if the person fell within the lower 5% of the sample distribution of ipsatized variance; (b) the Mahalanobis distance of a person’s response vector from the average sample response vector (Meade & Craig, 2012) if he or she fell within the upper 2.5% of the sample distribution of the Mahalanobis distance; and (c) response time, namely, if the person took, on average, less than 1 s to respond to an item. Our intention in choosing relatively liberal cut-off values was to avoid accidentally excluding valid cases and thereby creating a systematic bias in our data. All exclusion criteria were applied simultaneously, that is, any respondent who violated one or more of the three criteria was excluded from the analyses and that only those who met all three criteria were included. This approach resulted in total exclusion of 40 cases (7.9%) in the UK subsample and of 39 cases (7.6%) in the German subsample, yielding net sample sizes of NUK = 468 (retest: NUK = 111) and NDE = 474 (retest: NDE = 117). Table 2 depicts in detail the sample characteristics and their distribution.
Table 2
Sample Characteristic Features
|
|
United Kingdom |
Germany |
|
N |
468 |
474 |
|
Mean age in years (SD) [Range] |
45.2 (14.5) [18–69] |
44.0 (14.4) [18–69] |
|
Proportion of women (%) |
52.6 |
50.0 |
|
Educational level (%) |
|
|
|
Low: never went to school, skills for life/1–4 GCSEs A*–C or equivalent |
34.8 |
33.5 |
|
Middle: 5 or more GCSEs A*–C/vocational GCSE/GNVQ intermediate or equivalent |
32.1 |
33.8 |
|
High: 2 or more A-levels or equivalent |
33.1 |
32.7 |
Note. The equivalent German educational levels were as follows (from low to high): ohne Bildungsabschluss/Hauptschule [no educational qualification; lower secondary leaving certificate]; mittlerer Schulabschluss [intermediate school leaving certificate]; and (Fach-)Hochschulreife [higher education entrance qualification].
Material
Online surveys were conducted in German for the German sample and in English for the UK sample. The surveys comprised the respective language versions of KUSIV3, alongside sociodemographic characteristics and a range of external criteria.
To examine evidence based on the relationship between scores on KUSIV3 and scores on (a) the Big Five dimensions of personality, (b) general self-efficacy, (c) locus of control, (d) optimism–pessimism, (e) life satisfaction, (f) political efficacy, (g) political preferences, (h) socially desirable responding, and (i) health, respectively, the following short scale measures were also administered as part of the survey:
a) the extra-short form of the Big Five Inventory–2 (BFI-2-XS; English version: Soto & John, 2017; German version: Rammstedt, Danner, Soto, & John, 2020)
b) the General Self-Efficacy Short Scale–3 (GSE-3; Doll, Nießen, Schmidt, Rammstedt, & Lechner, 2021; German version: Allgemeine Selbstwirksamkeit Kurzskala; ASKU; )
c) the Internal–External Locus of Control Short Scale–4 (IE-4; Nießen, Schmidt, Groskurth, Rammstedt, & Lechner, 2022 ; German version: Internale-Externale-Kontrollüberzeugung–4;
d) the Optimism–Pessimism Short Scale–2 (SOP2; Nießen, Groskurth, Kemper, Rammstedt, & Lechner, 2022 ; German version: Skala Optimismus-Pessimismus-2; Kemper,
e) the General Life Satisfaction Short Scale (L-1; Nießen, Groskurth, Rammstedt, & Lechner, 2020; German version: Kurzskala zur Erfassung der Allgemeinen Lebenszufriedenheit;
f) the Political Efficacy Short Scale (PESS; Groskurth, Nießen, Rammstedt, & Lechner, 2021; German version: Political Efficacy Kurzskala; PEKS; Beierlein, Kemper, Kovaleva, & Rammstedt, 2014b)
g) the political Left–Right Self-Placement scale (English and German version: Breyer, 2015)
h) the Social Desirability–Gamma Short Scale (KSE-G; Nießen, Partsch, Kemper, & Rammstedt, 2019; German version: Kurzskala Soziale Erwünschtheit–Gamma; Kemper, Beierlein, Bensch, Kovaleva, & Rammstedt, 2014)
i) the single-item question used in the ESS to measure self-reported general health (ESS, 2016)
In addition, a set of sociodemographic variables (gender, age, highest level of education, income, and employment status) was collected.
Item analyses
We first investigated the factorial structure of KUSIV3 in the UK and Germany in two separate confirmatory factor analyses (CFA). Afterwards, we subsequently conducted multiple-group confirmatory factor analyses (MG-CFA) using a unidimensional measurement model developed for Germany by Beierlein, Kemper, et al. (2014a) with one latent factor capturing interpersonal trust. In both the UK and Germany, factor loadings and item intercepts were freely estimated, whereas the variance of the latent interpersonal trust factor was set to 1. We used a MLR estimation. The model is plotted in Figure 3. A latent measurement model with only three items and no further restrictions (e.g., equality restrictions on the loadings) is just-identified and has zero degrees of freedom. Therefore, it calculates the closed-form solution for the parameters. Only a multi-group model with equivalence restrictions provides an interpretable model fit (see section international equivalence). Even though the factor loadings of item 2, which is negatively keyed, are lower than the loadings of the other two positively keyed items, the size of the items’ factor loadings is consistent with a unidimensional measurement model (see Figure 3). That negatively worded items show larger loadings than positively worded ones is a frequently observed pattern (e.g., Lechner, Danner, & Rammstedt, 2019; Weijters, Baumgartner, & Schillewaert, 2013) that could be caused , for example, by acquiescence, a response style that causes negative loadings to be weaker than they would otherwise be (e.g., Lechner, Partsch, Danner, & Rammstedt, 2019; Lechner & Rammstedt, 2015).
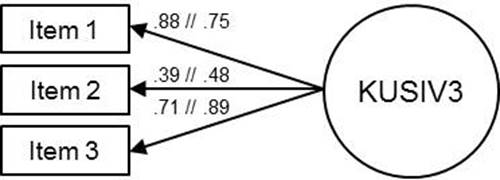
Figure 3. Unidimensional measurement model of KUSIV3 with standardized coefficients. The negatively keyed item is reverse-scored. The coefficients of the German sample are presented after the double slash. Item error terms are omitted for clarity. NUK = 468; NDE = 474.
Item parameters
Table 3 shows the means, standard deviations, skewness, and kurtosis for the three items separately for the English and German samples. The inter-item correlations are as follows: UK—r12 = .34, r13 = .62, r23 = .28; DE— r12 = .36, r13 = .67, r23 = .43.
Table 3
Descriptive Statistics for KUSIV3 Items
|
|
M |
SD |
Skewness |
Kurtosis |
||||
|
|
UK |
DE |
UK |
DE |
UK |
DE |
UK |
DE |
|
Item 1 |
3.21 |
3.17 |
1.01 |
0.97 |
−0.25 |
−0.22 |
−0.33 |
−0.33 |
|
Item 2 |
3.24 |
3.06 |
1.15 |
1.05 |
−0.30 |
−0.14 |
−0.64 |
−0.64 |
|
Item 3 |
3.15 |
2.97 |
0.97 |
0.91 |
−0.28 |
−0.11 |
−0.24 |
−0.20 |
Note. UK = United Kingdom (N = 468); DE = Germany (N = 474).
To empirically examine the English-language adaptation of KUSIV3 and to investigate its comparability with the German-language source version, we analyzed psychometric criteria—more precisely, objectivity, reliability, and validation evidence—in both language versions. Moreover, we assessed test fairness across both states via measurement invariance tests. The statistical analysis was run with R.
Objectivity
A scale can be regarded as objective when it works (a) independently of the administrator (objectivity of application); (b) independently of the evaluator of the test (objectivity of evaluation); and (c) when unambiguous and user-independent rules are provided (objectivity of interpretation). The standardized questionnaire format and written instructions, the fixed scoring rules and labeled categories, and the reference ranges ensured the objectivity of the application, evaluation, and interpretation of KUSIV3.
Reliability
As estimates for the reliability of KUSIV3, we computed Cronbach’s alpha (Cronbach, 1951), McDonald’s omega (McDonald, 1999; Raykov, 1997), and the test–retest stability. The rationale for using these measures was twofold. First, we wanted to provide information on the most commonly used reliability estimate, namely Cronbach’s alpha, although the appropriateness of this measure of internal consistency is limited in the case of ultra-short scales, where items are selected to reflect the bandwidth of the underlying dimension (i.e., its heterogeneity but not its homogeneity). Second, because we specified a tau-congeneric model, we also report McDonald’s omega, as it is a more appropriate measure than Cronbach’s alpha in the current context.
The reliability estimates for KUSIV3 ranged between .67 and .78 (UK) and .73 and .79 (DE), which can be deemed sufficient for research purposes (Aiken & Groth-Marnat, 2006; Kemper, Trapp, Kathmann, Samuel, & Ziegler, 2019). As often occurs with (ultra-)short scales, test–retest reliability (UK: rtt = .78; DE: rtt = .79) was higher than internal consistency (UK: α = .67, ω = .69; DE: α = .73, ω = .75). In detail, KUSIV3 proved to be slightly more reliable in Germany than in the UK (except in the case of test–retest stability). Because internal consistency estimates vary across groups, test–retest correlations are recommended for a comparison of the reliability of scale scores.
Validity
Besides content-related evidence, which was provided by Beierlein, Kemper, et al. (2014a) during the original scale development process, we investigated two types of validation evidence: evidence based on the internal structure of the scale and evidence based on the relationship between scores on the scale and on other variables. The dimensionality of the construct and the size of the items’ factor loadings (see Figure 3) give an indication of the internal structure of the scale.
Evidence based on the relationship between scores on KUSIV3 and on other variables was computed based on manifest correlations. We preferred manifest correlations over latent ones in order to remain consistent (some correlates, such as age and gender, do not have measurement errors) and to be able to compare the single effect sizes with each other. Therefore, the reported values probably represent the lower bound of the true associations. The correlation coefficients are depicted in Table 4; their interpretation is based on Cohen (1992): small effect (r ≥ .10), medium effect (r ≥ .30), and strong effect (r ≥ .50). Due to alpha accumulation through multiple testing, only coefficients with a significance level above p < .001 are interpreted (this is the threshold after Bonferroni adjustment—we use adjusted significance levels only to decide which significant correlations should be used for interpretation; Table 4 displays unadjusted p values). Before computing the correlations, we recoded item 2, the health variable, and the “minimizing negative qualities” subdimension of socially desirable responding.
In order to investigate this type of evidence, we correlated KUSIV3 with the following constructs and criteria: (a) the Big Five dimensions Extraversion, Agreeableness, Conscientiousness, Emotional Stability, and Openness assessed with the BFI-2-XS (Rammstedt et al., 2020; Soto & John, 2017); (b) general self-efficacy assessed with GSE-3 (Doll et al., 2021)/ASKU (); (c) internal and external locus of control assessed with IE-4 (Nießen, Schmidt, et al., 2022; (d) optimism and pessimism assessed with SOP2 (Kemper, Beierlein, Kovaleva, et al., Nießen, Groskurth, et al., 2022; (e) general life satisfaction assessed with L-1 (Nießen et al., 2020; (f) internal and external political efficacy assessed with PESS (Groskurth et al., 2021)/PEKS (Beierlein, Kemper, et al., 2014b); (g) political preferences assessed with the Left–Right Self-Placement scale (Breyer, 2015); (h) socially desirable responding assessed with KSE-G (Kemper, Beierlein, Bensch, et al., 2014; Nießen et al., 2019); and (i) self-reported general health measured with the single-item question used in the ESS (2016).
Correlations with convergent and discriminant constructs
With regard to personality in terms of the Big Five dimensions, previous research suggests strongest associations of interpersonal trust with Agreeableness (see also Evans & Revelle, 2008; Omodei & McLennan, 2000; Perunovic, 2008), which supports the notion that trust is a facet of the Agreeableness dimension (e.g., Costa, McCrae, & Dye, 1991). In addition, strong positive associations with Emotional Stability have been consistently reported (see also Evans & Revelle, 2008; Halamandaris & Power, 1997; Omodei & McLennan, 2000). For the German-language version of KUSIV3, initial findings by Beierlein, Kemper, et al. (2014a) replicate these associations. In the present analyses, too, strong positive relations of KUSIV3 with Agreeableness and Emotional Stability were found for both the UK and Germany and thus for both language versions. Partly in line with previous findings (Beierlein, Kemper, et al., 2014a; Evans & Revelle, 2008; Halamandaris & Power, 1997), we also found a small but substantial positive association of interpersonal trust with Extraversion, but only for the UK. However, unlike Beierlein, Kemper, et al. (2014a), who found small positive associations of Openness and Conscientiousness with interpersonal trust, we found zero correlations for both the UK and Germany.
With regard to internal locus of control, optimism–pessimism, and external political efficacy, we could replicate the findings of the German-language source version: Consistent with previous findings, including those of Beierlein, Kemper, et al. (2014a), we found—for both the UK and Germany—stable small-to-medium positive relations with internal locus of control (e.g., Massari & Rosenblum, 1972; Stimpson & Maughan, 1978), optimism (e.g., Mealy, Stephan, Mhaka-Mutepfa, & Alvarado-Sanchez, 2015; Schweer, 2006), and external political efficacy (e.g., Koller, 1992; Schiffman et al., 2010; Schyns & Koop, 2010). Individuals high in optimism and external political efficacy had a higher propensity for interpersonal trust. Concerning general self-efficacy and external locus of control, we could fully support the findings for the German-language source version; for internal political efficacy, we could do so only for the English-language adaptation: In the German sample, there was a small positive effect for general self-efficacy (see also Munir et al., 2016) and a small negative effect for external locus of control (see Thurber & Friedli, 1976), whereas in the UK sample there were zero or no reportable correlations. In contrast, there was a small positive effect for internal political efficacy in the UK sample but no reportable correlation in the German sample. In line with Rotter (1967, 1971), there was a small positive association with socially desirable responding in both samples, but only for the “exaggerating positive qualities” subscale, which depicts the self-deceptive enhancement component of communion-induced socially desirable responding (Nießen et al., 2019). Even though we found—among others—partially different correlations in both states, in sum, the pattern of correlations suggests evidence based on scale–construct relationships.
Correlations with concurrent criteria
Concerning life satisfaction and health, we could replicate the findings of Beierlein, Kemper, et al. (2014a): In line also with other previous findings, we found in both the UK and DE samples stable small-to-medium positive associations with life satisfaction (e.g., Barefoot et al., 1998; Jovanović, 2016) and health (e.g., Barefoot et al., 1998; Feng, Vlachantoni, Liu, & Jones, 2016; Schneider, Konijn, Righetti, & Rusbult, 2011). Individuals who reported greater life satisfaction and better general health had a higher propensity for interpersonal trust. In addition, we found a negative relation between interpersonal trust and political left–right self-placement (DE only). Individuals who placed themselves more on the left of the political spectrum had a higher propensity for interpersonal trust, and those who placed themselves more on the right of the spectrum had a lower propensity for interpersonal trust. This is in line with evidence from Krampen et al. (1982) that conservatism is related more to social distrust. Despite these contrary results concerning political self-placement, the pattern of correlations suggests evidence based on scale–criterion relationships in view of the findings on life satisfaction and health.
Table 4
Correlations of KUSIV3 with Relevant Variables
|
|
UK |
DE |
||
|
|
r |
CI95% |
r |
CI95% |
|
Big Five |
|
|
|
|
|
Extraversion |
.16*** |
[.07, .25] |
.06 |
[−.03, .15] |
|
Agreeableness |
.37*** |
[.29, .45] |
.36*** |
[.28, .44] |
|
Conscientiousness |
.03 |
[−.06, .12] |
.06 |
[−.03, .15] |
|
Emotional Stability |
.32*** |
[.40, .24] |
.30*** |
[.38, .22] |
|
Openness |
.08 |
[−.01, .17] |
.04 |
[−.05, .13] |
|
General self-efficacy |
.10* |
[.01, .19] |
.17*** |
[.08, .26] |
|
Locus of control |
|
|
|
|
|
Internal |
.16*** |
[.08, .25] |
.16*** |
[.07, .24] |
|
External |
−.06 |
[−.15, .04] |
−.22*** |
[−.30, −.13] |
|
Optimism–pessimism |
.42*** |
[.35, .49] |
.43*** |
[.35, .50] |
|
Political efficacy |
|
|
|
|
|
Internal |
.17*** |
[.08, .25] |
.10* |
[.01, .19] |
|
External |
.16*** |
[.08, .25] |
.28*** |
[.20, .37] |
|
Left–right self-placement |
−.10 |
[−.21, .01] |
−.25*** |
[−.34, −.15] |
|
Social desirability |
|
|
|
|
|
Exaggerating positive qualities |
.24*** |
[.16, .33] |
.17*** |
[.08, .25] |
|
Minimizing negative qualities |
−.02 |
[−.11, .07] |
.13** |
[.04, .21] |
|
Life satisfaction |
.41*** |
[.33, .48] |
.35*** |
[.27, .43] |
|
Health |
.24*** |
[−.32, −.15] |
.18*** |
[−.27, −.09] |
|
Sociodemographic characteristics |
|
|
|
|
|
Employment status |
−.03 |
[−.12, .06] |
−.06 |
[−.15, .03] |
|
Income |
.15** |
[.06, .24] |
.20*** |
[.11, .29] |
|
Educational level |
.11* |
[.01, .19] |
.09 |
[.00, .17] |
|
Age |
.17*** |
[.08, .25] |
.13** |
[.04, .22] |
|
Gender |
−.12** |
[−.12, −.03] |
.01 |
[−.08, .10] |
Note. UK = United Kingdom (N = 468; NLeft–right self-placement = 325; NEmployment status = 450; NIncome = 431); DE = Germany (N = 474; NLeft–right self-placement = 394; NEmployment status = 462; NIncome = 449); CI = confidence interval. Optimism–pessimism: very pessimistic (1) – very optimistic (7). Health: very bad (1) – very good (5). Gender: 1 = male, 2 = female.
*p < .05, **p < .01, ***p < .001. Coefficients significant on the < .001 level are set in boldface.
Correlations with sociodemographic characteristics
We calculated correlations between KUSIV3 and relevant sociodemographic characteristics, namely employment status, income, educational level, age, and gender. In the present analyses, we found small positive correlations between interpersonal trust and income (DE only) and age (UK only). Individuals with a higher income (DE only) and elderly individuals (UK only) had a greater propensity for interpersonal trust. The first-mentioned finding is in line with evidence from Bulloch (2010) that interpersonal trust increases with a higher income; the latter finding is in line with evidence from Bulloch (2010) and Krampen et al. (1982) that interpersonal trust increases with age. There were no associations between interpersonal trust and employment status, and no reportable associations between interpersonal trust and educational level (unlike Bulloch, 2010; Krampen et al., 1982), gender (unlike Bulloch, 2013; Zinchenko, Zotova, & Tarasova, 2017), age (DE only), and income (UK only).
Descriptive statistics
Table 5 provides the reference ranges in terms of means, standard deviations, skewness, and kurtosis of the KUSIV3 scale scores for the total population, as well as separately for gender and age groups in both states. Standard values are not available.
Table 5
Reference Ranges of the KUSIV3 Scale Scores for the Total Population and Separately for Gender and Age Groups
|
|
M |
SD |
Skewness |
Kurtosis |
||||
|
|
UK |
DE |
UK |
DE |
UK |
DE |
UK |
DE |
|
|
|
|
|
|
|
|
|
|
|
Total population |
3.20 |
3.07 |
0.81 |
0.79 |
−0.38 |
−0.16 |
−0.04 |
−0.18 |
|
|
|
|
|
|
|
|
|
|
|
Male [nUK = 222; nDE = 237] |
3.30 |
3.06 |
0.78 |
0.79 |
−0.58 |
−0.32 |
0.48 |
−0.29 |
|
Female [nUK = 246; nDE = 237] |
3.10 |
3.08 |
0.83 |
0.79 |
−0.20 |
−0.01 |
−0.32 |
−0.12 |
|
|
|
|
|
|
|
|
|
|
|
18−29 [nUK = 104; nDE = 105] |
2.96 |
2.97 |
0.87 |
0.77 |
−0.04 |
−0.16 |
−0.47 |
−0.49 |
|
30−49 [nUK = 180; nDE = 191] |
3.20 |
3.02 |
0.75 |
0.76 |
−0.68 |
−0.11 |
0.22 |
−0.34 |
|
50−69 [nUK = 184; nDE = 178] |
3.32 |
3.17 |
0.81 |
0.82 |
−0.34 |
−0.26 |
0.07 |
0.05 |
Note. UK = United Kingdom (N = 468); DE = Germany (N = 474).
Further quality criteria
Due to its short completion time (~ 30 s), the instrument can be seen as economic.
We assessed international equivalence across the UK and Germany via measurement invariance tests with MG-CFA (Vandenberg & Lance, 2000; Widaman & Reise, 1997). As mentioned above, the configural model has zero degrees of freedom; therefore, no misfit can occur. In order to determine the level of measurement invariance, we used the cut-off values recommended by Chen (2007). According to these benchmarks, SRMR as well as MLR-scaled CFI and RMSEA indicate that metric measurement invariance of KUSIV3 holds across the UK and Germany, implying comparability of correlations based on the latent factors between both states (metric model: CFI [comparative fit index] = .994, RMSEA [root mean square error of approximation] = .046, SRMR = .021; scalar model: CFI = .977, RMSEA = .067, SRMR = .031; the fit indices refer to the commonly used MLR-scaled CFI and RMSEA, which—strictly speaking—apply only to populations).[2] Full scalar invariance does not hold, but partial scalar invariance holds by setting the intercept of item 1 free (CFI = .994, RMSEA = .039, SRMR = .023),[3] which implies that latent means can be directly compared.
Further literature
The scale was first published in the journal Measurement Instruments for the Social Sciences.
Acknowledgement
We would like to thank Melanie Partsch and Katharina Groskurth from GESIS – Leibniz Institute for the Social Sciences for preparing the data.
The study was funded by an internal grant provided by GESIS – Leibniz Institute for the Social Sciences.
[2] Taking the sample size into account prevents biased fit indices and yields so-called robust CFI and robust RMSEA values in R/lavaan (Brosseau-Liard & Savalei, 2014; Brosseau-Liard, Savalei, & Li, 2012): metric model—robust CFI = .996, robust RMSEA = .055; scalar model—robust CFI = .985, robust RMSEA = .074.
[3] Robust CFI = .996, robust RMSEA = .045.
Désirée Nießen, GESIS – Leibniz Institute for the Social Sciences, P.O. Box 12 21 55, 68072 Mannheim, Germany; e-mail: desiree.niessen@gesis.org
The dataset supporting the conclusions of this article is available in the GESIS datorium repository, https://doi.org/10.7802/1861.