Political Efficacy Short Scale (PESS)
Autor/in:
Groskurth, K., Nießen, D., Rammstedt, B., & Lechner, C. M.
In ZIS seit:
2021
Downloads
Aktionen
Nutzungsbedingungen
Zur Nutzung für andere Zwecke kontaktieren Sie die Autor*innen
Zusammenfassung:
Abstract:
The Political Efficacy Short Scale (PESS) is the English-language adaptation of the German-language Political Efficacy Kurzskala (PEKS); it measures perceived political efficacy with four items. PESS comprises two subscales – internal and external political efficacy – with two items each. Internal political efficacy refers to the belief in one's own political effectiveness; external political efficacy refers to the belief in the responsiveness of the political system to citizens – concerns. Completion time for all four items is less than 30 s. The items of the German-language source version were translated into English using the TRAPD approach. The present study empirically validated the English-language adaptation (PESS) based on a heterogeneous quota sample in the UK. The results show that the reliability and validity coefficients of the English-language adaptation are sufficiently high and that they are comparable to those of the German-language source version. In addition, the scale showed strict measurement invariance (i.e., equal loadings, intercepts, and uniquenesses) when comparing the UK and Germany, which indicates the comparability of manifest scale scores (means and variances) and correlations across the two nations. As a short scale, PESS lends itself particularly to the measurement of political efficacy in survey contexts in which assessment time or questionnaire space is limited. It is applicable in a variety of research disciplines, including political science, sociology, psychology, and economics.
Sprache Dokumentation:
English
Sprache Items:
English, German (source)
Anzahl der Items:
4
Erhebungsmodus:
CASI
Bearbeitungszeit:
< 1 min
Reliabilität:
retest ≥ .68; McDonald's omega ≥ .84
Validität:
evidence for factorial, construct, and criterion validity
Konstrukt:
political efficacy (internal political efficacy, external political efficacy)
Schlagwörter:
political system, self-efficacy
Item(s) in Bevölkerungsumfrage eingesetzt:
yes
Skalenentwicklung:
Instruction
“In the following we are interested in your opinion concerning politics. You can agree to the statements below to a greater or lesser extent. Please indicate to what extent you agree or disagree with each of the statements.”
Items
Table 1
Items of the English-Language Adaptation of the Political Efficacy Short Scale (PESS)
|
No. |
Item |
Subscale |
|
1 |
I am good at understanding and assessing important political issues. |
Internal |
|
2 |
Politicians strive to keep in close touch with the people. |
External |
|
3 |
I have the confidence to take active part in a discussion about political issues. |
Internal |
|
4 |
Politicians care about what ordinary people think. |
External |
Note. Internal = internal political efficacy, external = external political efficacy.
Response specifications
Items are answered using a 5-point rating scale ranging from do not agree at all (1) to completely agree (5).
Scoring
The Political Efficacy Short Scale (PESS) consists of two items covering the two aspects of the political efficacy, namely internal political efficacy and external political efficacy. The English-language items are displayed in Table 1 (for the original German items, see Beierlein, Kemper, et al., 2014b). As in the German source instrument, all items are formulated positively in the direction of the underlying aspect. The scale score of political efficacy is computed separately for each subscale (internal and external political efficacy). For this purpose, the unweighted mean score of the two items of each subscale is computed. We suggest that individual answers should be aggregated to the scale level only if there are no missing values.
Application field
PESS is the English-language adaptation of the German-language Political Efficacy Kurzskala (PEKS); it measures perceived political efficacy with four items. PESS comprises two subscales—internal and external political efficacy—with two items each. Internal political efficacy refers to the belief in one’s own political effectiveness; external political efficacy refers to the belief in the responsiveness of the political system to citizens’ concerns. Completion time for all four items is less than 30 s. The items of the German-language source version were translated into English using the TRAPD approach. The present study empirically validated the English-language adaptation (PESS) based on a heterogeneous quota sample in the UK. The results show that the reliability and validity coefficients of the English-language adaptation are sufficiently high and that they are comparable to those of the German-language source version. In addition, the scale showed strict measurement invariance (i.e., equal loadings, intercepts, and uniquenesses) when comparing the UK and Germany, which indicates the comparability of manifest scale scores (means and variances) and correlations across the two nations. As a short scale, PESS lends itself particularly to the measurement of political efficacy in survey contexts in which assessment time or questionnaire space is limited. It is applicable in a variety of research disciplines, including political science, sociology, psychology, and economics. PESS/PEKS is typically self-administrated, such as via paper-and-pencil or online questionnaire. However, provided slight adaptations to the instructions, an oral administration in a personal interview or telephone interview is also conceivable.
What is political efficacy?
The concept “sense of political efficacy” was developed by Campbell et al. (1954, p. 187), who defined it as “the feeling that individual political action does have, or can have, an impact upon the political process, i.e., that it is worthwhile to perform one’s civic duties. It is the feeling that the individual citizen can play a part in bringing about this change.”
The focus of Campbell and colleagues’ research was on perceived political efficacy as a potential explanatory variable for variation in electoral participation. Later work on the construct diverged into two different perspectives: One line of research focused on the importance of political efficacy for the individual (e.g., Renshon, 1975); the other focused on the importance of political efficacy for the political system (e.g., Almond & Verba, 1963).
Internal and external political efficacy
Campbell et al. (1954) conceived “sense of political efficacy” as a unidimensional construct. Balch (1974) was the first to empirically examine the factor structure of a slightly modified version of Campbell et al.’s original measure of the concept. He extracted two components of “sense of political efficacy”: internal political efficacy (personal effectiveness; Craig & Maggiotto, 1982) and external political efficacy (system responsiveness; Craig & Maggiotto, 1982). More specifically, internal political efficacy refers to the belief that one is capable of understanding politics and engaging in political acts. In contrast, external political efficacy refers to the individual’s belief in the responsiveness of political institutions and leaders to citizens’ concerns (W. E. Miller & Traugott, 1989).
The relationship between internal and external efficacy is typically weak because these two components of political efficacy have different referents: oneself (in the case of internal political efficacy) and politicians and political institutions (in the case of external political efficacy; Craig & Maggiotto, 1982; W. E. Miller & Traugott, 1989). Previous findings have shown that internal and external political efficacy are positively associated with each other in democratic contexts (e.g., Craig, 1979; Morrell, 2003; Muller, 1970; Niemi et al., 1991) but largely independent of each other in authoritarian regimes (e.g., Muller, 1970). For instance, Muller (1970) found a medium correlation between internal and external political efficacy in the United States but an almost zero correlation in Mexico. This suggests that, through socialization, people in democratic regimes learn to believe in the responsiveness of their governments (see also Easton & Dennis, 1967). The existence of a norm of regime responsiveness encourages people to develop the skills and, accordingly, the self-conviction to be able to exert influence on governmental decisions (Muller, 1970). In contrast, people in authoritarian regimes may experience a discontinuity in regime responsiveness during their socialization process, which hinders them from acquiring a stable political norm of regime responsiveness. Although people in authoritarian regimes may possess the skills and, accordingly, the conviction to influence politics, the skills and conviction do not match reality. Due to the authoritarian nature of the regime, people are unable to make use of their political skills. They cannot exert political influence; the government does not respond to their concerns (Muller, 1970). Thus, the strength of the association between internal and external political efficacy varies with regime type.
Internal and external political efficacy also show different patterns of associations with external correlates (e.g., potential causes or effects). On the one hand, internal political efficacy is robustly associated with participation in campaign- and community-oriented activities (e.g., Craig, 1979; Morrell, 2003; Niemi et al., 1991). High internal political efficacy corresponds also with (positive attitudes toward) political protest (e.g., Balch, 1974; Craig & Maggiotto, 1982; Šerek et al., 2017). Thus, participatory experiences seem to boost individuals’ perceived political effectiveness (Šerek et al., 2017). Furthermore, high educational attainment, social status, personal interest, political attentiveness, and political information lead to stronger convictions of internal political efficacy (e.g., Craig & Maggiotto, 1982; Morrell, 2003; Niemi et al., 1991). Internal political efficacy is also related to personality: People who are high in Openness are commonly critical thinkers; people who are high in Extraversion are often dominant, assertive, and persuasive. Thus, these two Big Five traits are commonly associated with (internal) political efficacy (Vecchione & Caprara, 2009).
Convictions about external political efficacy have been found to vary as a function of political context and regime performance (Coleman & Davis, 1976). For example, a nation with a functioning democratic system elicits a strong perception of external political efficacy (Coleman & Davis, 1976). External political efficacy is also closely connected to political trust (e.g., Balch, 1974; Craig, 1979; Niemi et al., 1991). A. H. Miller (1974) defined political distrust as the belief in a dysfunction of the political system in which political outputs diverge from the public’s interest. Thus, it is reasonable that people put trust in their government as long as they are convinced that it responds to the public’s concerns—that is, as long as people have a strong conviction of external political efficacy (Craig & Maggiotto, 1982). In contrast, high willingness to engage in political protest is associated with low external political efficacy (Balch, 1974; Šerek et al., 2017), which may be due to “disappointing outcomes, in which the demands of the protesting citizens were not fulfilled” (Šerek et al., 2017, p. 354).
Item generation and selection
In 1952, the American National Election Studies (ANES) first included a measure of sense of political efficacy, which was conceived of as a unidimensional construct (e.g., Campbell et al., 1954; Morrell, 2003). After theoretical and empirical findings underlined the two-dimensionality of the construct (Balch, 1974), researchers tried to map Campbell and colleagues' (1954) original four items onto the two dimensions, internal and external political efficacy. As these attempts encountered problems with reliability and validity, researchers constructed new scales or employed variants of the original items. However, the new scales and the variants of the original items were still ambiguously defined, and it was not possible to clearly differentiate between the constructs of internal and external political efficacy (for an overview and empirical analyses, see Craig & Maggiotto, 1981; Morrell, 2003; Vetter, 1997). To remedy the issues encountered in covering the two dimensions with Campbell et al.’s original item set, several short scales were newly developed. Some of these newly developed short scales covered only one dimension, most often internal political efficacy (e.g., the four-item Perceived Political Self-Efficacy Scale—Short Form by Vecchione et al., 2014). Others incorporated items in equal share for both internal and external political efficacy. Besides the political efficacy scale of the European Social Survey (ESS, n.d.), Beierlein, Kemper, et al. (2014b) constructed a four-item short scale of internal and external political efficacy with five response options—the Political Efficacy Kurzskala (PEKS). Whereas the former has already been translated into many different European languages (e.g., German, English, Dutch, Spanish), the latter has, to date, only been validated for the German language, even though it was also available in English. We, however, deem PEKS as more promising than the political efficacy scale of the ESS because the items of PEKS are worded more succinctly. Because Beierlein, Kemper, et al. (2014b) used statements instead of questions, the items of PEKS are shorter and therefore more economical than in the ESS. Furthermore, the labels in the response options differ in the ESS, whereas they stayed the same across items of PEKS, which makes PEKS more comparable.
In the following, we will focus on the short scale developed by Beierlein, Kemper, et al. (2014b)—PEKS—which measures internal and external political efficacy validly and with sufficient reliability despite its short length. The authors also reported evidence for the validity of the scale. The German-language scale was developed based on theoretical and empirical analyses. A multistep procedure was followed: First, by reanalyzing survey data (Andreß et al., 2011; Falter et al., 2015), Beierlein, Kemper, et al. (b) compared different operationalizations of political efficacy, including items from Niemi et al. (1991) and Vetter (1997). Based on this sample of items, they selected those items that best represented the theoretical bandwidth of (self-)convictions of political competencies and influence. Second, experts in survey research linguistically modified the selected items, especially to reduce the cognitive effort needed to understand them (Beierlein, Kemper, et al., 2014b). In doing so, test fairness was ensured—that is, the items were constructed to be unbiased across different social strata. In order to arrive at an ultra-short scale, only two items per dimension were finally selected based on the analysis of the first sample. Third, based on two different samples, including one random sample representative of the adult population in Germany, Beierlein, Kemper, et al. (2014b) validated the German-language PEKS, administered as a personal interview. The results supported good psychometric properties of the scale (see Beierlein, Kemper, et al., 2014b).
To enable their scale to be used outside the German research context, Beierlein, Kemper, et al. (2014b) translated the German-language version into English. Following the International Test Commission (2010) recommendations, the translation process followed the TRAPD approach (Translation, Review, Adjudication, Pretesting, and Documentation; Harkness, 2003) and consisted of two major steps: First, two professional translators (native speakers) translated the items independently of each other; one of them translated into British English, the other into American English. Second, the translation proposals were discussed, revised, and finalized by a team comprising the two translators, researchers with expertise in the area of political efficacy, and a researcher proficient in questionnaire translation.
The aim of the present study is to validate the English-language adaptation of PEKS, the Political Efficacy Short Scale (PESS), and to compare its psychometric properties with those of the German-language source version. Additionally, as the hypothesized two-factor structure of PESS has not yet been confirmed for the German-language version, the present study addresses this research gap and evaluates the factor structure for both the German and English versions. If both versions prove to be psychometrically valid and of high quality, the measure will advance cross-cultural research on political efficacy.
Samples
To investigate the dimensionality and psychometric properties of PESS, the English-language adaptation of PEKS, and their comparability with those of the German-language source instrument, we assessed both versions in a web-based survey (using computer-assisted self-administered interviewing [CASI]). The survey was conducted in parallel in the United Kingdom (UK) and Germany (DE) by the online access panel provider respondi AG.
Fielding took place in January 2018. For both the UK and Germany, quota samples were drawn that represented the heterogeneity of the adult population in terms of age, gender, and educational attainment based on the latest German census from 2011 (https://ergebnisse.zensus2011.de). Only native speakers of the respective languages were recruited. Respondents were financially rewarded for their participation. To allow for the investigation of test–retest stability of the scale in both nations, a subsample was reassessed after approximately 3 to 4 weeks (MdnUK = 28 days; MdnDE = 20 days).
Only respondents who completed the full questionnaire—that is, who did not abort the survey prematurely—were included in our analyses. This yielded gross sample sizes of NUK = 508 for the UK and NDE = 513 for Germany. These samples were further reduced by excluding invalid cases based on three criteria. First, respondents with an ipsatized variance—that is the within-person variance across items (Kemper & Menold, 2014)—below 5% were excluded. The second criterion was the Mahalanobis distance of a person’s response vector from the average sample response vector (Meade & Craig, 2012). If respondents fell within the upper 2.5% of the sample distribution of the Mahalanobis distance, they were excluded from the sample. Third, response times were evaluated. If respondents answered all items in—on average—less than 1 s per item, they were excluded.[1] The outlined approach resulted in the exclusion of 8% of cases in both the UK and the German subsamples, yielding net sample sizes of NUK = 468 (retest: NUK = 111) and NDE = 474 (retest: NDE = 117). Table 2 depicts in detail the sample characteristics and their distribution. Table 3 shows the target and real sample size per quota.
Table 2
Sample Characteristics, United Kingdom and Germany
|
|
United Kingdom |
Germany |
|
N |
468 |
474 |
|
Mean age in years (SD) [Range] |
45.2 (14.5) [18–69] |
44.0 (14.4) [18–69] |
|
Proportion of women (%) |
52.6 |
50.0 |
|
Educational attainment (%) |
|
|
|
Low |
34.8 |
33.5 |
|
Intermediate |
32.1 |
33.8 |
|
High |
33.1 |
32.7 |
Note. The educational attainment levels were as follows: Low = never went to school/Skills for Life/1–4 GCSEs A*–C or equivalent (Germany: ohne Bildungsabschluss/Hauptschule [no educational qualifications; lower secondary leaving certificate]); intermediate = 5 or more GCSEs A*–C/vocational GCSE/GNVQ intermediate or equivalent (Germany: mittlerer Schulabschluss [intermediate school leaving certificate]); high = 2 or more A-levels or equivalent (Germany: (Fach-)Hochschulreife [higher education entrance qualification]).
Table 3
Quotas: Target and Real Sample Sizes for the UK and Germany
|
Quota no. |
Gender |
Educational attainment |
Age |
Target n per quota |
Real n per quota |
|
|
United Kingdom |
Germany |
|||||
|
1 |
male |
low |
18–29 |
22 (4.4%) |
15 (3.2%) |
15 (3.2%) |
|
2 |
30–49 |
32 (6.5%) |
27 (5.8%) |
29 (6.1%) |
||
|
3 |
50–69 |
41 (8.3%) |
38 (8.1%) |
40 (8.4%) |
||
|
4 |
intermediate |
18–29 |
21 (4.3%) |
17 (3.6%) |
19 (4.0%) |
|
|
5 |
30–49 |
32 (6.3%) |
28 (6.0%) |
30 (6.3%) |
||
|
6 |
50–69 |
21 (4.1%) |
21 (4.5%) |
24 (5.1%) |
||
|
7 |
high |
18–29 |
18 (3.5%) |
17 (3.6%) |
17 (3.6%) |
|
|
8 |
30–49 |
37 (7.4%) |
33 (7.1%) |
37 (7.8%) |
||
|
9 |
50–69 |
26 (5.1%) |
26 (5.6%) |
26 (5.5%) |
||
|
10 |
female |
low |
18–29 |
16 (3.2%) |
15 (3.2%) |
13 (2.7%) |
|
11 |
30–49 |
24 (4.9%) |
21 (4.5%) |
22 (4.6%) |
||
|
12 |
50–69 |
44 (8.8%) |
47 (10.0%) |
40 (8.4%) |
||
|
13 |
intermediate |
18–29 |
22 (4.4%) |
19 (4.1%) |
21 (4.4%) |
|
|
14 |
30–49 |
39 (7.8%) |
36 (7.7%) |
37 (7.8%) |
||
|
15 |
50–69 |
29 (5.7%) |
29 (6.2%) |
29 (6.1%) |
||
|
16 |
high |
18–29 |
21 (4.1%) |
21 (4.5%) |
20 (4.2%) |
|
|
17 |
30–49 |
36 (7.2%) |
35 (7.5%) |
36 (7.6%) |
||
|
18 |
50–69 |
20 (3.9%) |
23 (4.9%) |
19 (4.0%) |
||
|
|
|
|
N |
501 (100%) |
468 (100%) |
474 (100%) |
Note. The educational attainment levels were as follows: Low = never went to school/Skills for Life/1–4 GCSEs A*–C or equivalent (Germany: ohne Bildungsabschluss/Hauptschulabschluss [no educational qualifications; lower secondary leaving certificate]); intermediate = 5 or more GCSEs A*–C/vocational GCSE/GNVQ intermediate or equivalent (Germany: Mittlere Reife [intermediate school leaving certificate]); high = 2 or more A-levels or equivalent (Germany: (Fach-)Hochschulreife [higher education entrance qualification]). The target n per quota was calculated from the latest German census from 2011 (https://ergebnisse.zensus2011.de). The real n per quota was calculated after data cleansing.
Material
The online surveys were conducted in English for the UK sample and in German for the German sample using PESS and PEKS, respectively. We validated PESS against different constructs. Our choice of correlates was driven by theoretical considerations and by data availability because PESS was part of a multi-theme survey. On theoretical grounds, we selected the following correlates: (1) correlates that reflect general psychological resources (i.e., [a] the Big Five dimensions of personality, [b] general self-efficacy, [c] locus of control, [d] optimism–pessimism, [e] interpersonal trust, and [f] general life satisfaction), which we expected to correlate positively with internal political efficacy as a domain-specific manifestation of personal resources; (2) correlates that reflect political and social attitudes, values, and behaviors (e.g., [g] political preferences, [h] authoritarianism, and [i] justice sensitivity), which we expected to correlate with internal and external political efficacy in different and non-negligible ways; (3) sociodemographic correlates, whose correlations with PESS would indicate differences in internal and external political efficacy across subpopulations such as age groups, gender, and educational attainment, which one would generally assume to exist. We also (4) probed the proneness of PESS for socially desirable responding by correlating it with (j) a social desirability scale.[2] Accordingly, the following short-scale measures were also administered as part of the survey:
a) The extra-short form of the Big Five Inventory–2 (BFI-2-XS; English version: Soto & John, 2017; German version: Rammstedt et al., 2020)
b) The General Self-Efficacy Short Scale–3 (GSE-3; Doll et al., 2021)/Allgemeine Selbstwirksamkeit Kurzskala (ASKU; Beierlein, Kovaleva, et al., 2014)
c) The Internal–External Locus of Control Short Scale–4 (IE-4; Nießen, Schmidt, et al., 2022)/Internale–Externale-Kontrollüberzeugung–4 (Kovaleva et al., 2014)
d) The Optimism–Pessimism Short Scale–2 (SOP2; Nießen, Groskurth, et al., 2022) /Skala Optimismus–Pessimismus–2 (Kemper, Beierlein, Kovaleva, et al., 2014)
e) The Interpersonal Trust Short Scale (KUSIV3; Nießen, Beierlein, et al., 2020)/Kurzskala Interpersonelles Vertrauen (Beierlein, Kemper, et al., 2014a)
f) The General Life Satisfaction Short Scale (L-1; Nießen, Groskurth, et al., 2020)/Kurzskala zur Erfassung der Allgemeinen Lebenszufriedenheit (Beierlein et al., 2015)
g) The political Left–Right Self-Placement scale (English and German versions: Breyer, 2015)
h) The Authoritarianism Short Scale (KSA-3; Nießen, Schmidt, et al., 2019)/Kurzskala Autoritarismus (Beierlein, Asbrock, et al., 2014)
i) The Justice Sensitivity Short Scales–8 (JSS-8; Groskurth et al., 2023)/Ungerechtigkeitssensibilität-Skalen-8 (USS-8; Beierlein, Baumert, et al., 2014)
j) The Social Desirability–Gamma Short Scale (KSE-G; Nießen, Partsch, et al., 2019)/Kurzskala Soziale Erwünschtheit–Gamma (Kemper, Beierlein, Bensch, et al., 2014)
In addition, a set of sociodemographic variables (employment, income, educational attainment, age, and gender) was assessed. Employment was surveyed with the following nominal categories: “employed” (1), “self-employed” (2), “out of work and looking for work” (3), “out of work but not currently looking for work” (4), “doing housework” (5), “pupil/student” (6), “apprentice/internship” (7), “retired” (8), and “none of what is mentioned above” (9). We recoded the variable into the following categories: “unemployed” (1), which comprises “out of work and looking for work” and “out of work but not currently looking for work,” and “employed” (2), which comprises “employed” and “self-employed.” All other categories were recoded as missing values.
We ran all statistical analyses with R (version 3.6.1), using the packages lavaan (Rosseel, 2012), psych (Revelle, 2018), and semTools (Jorgensen, et al., 2019).
Item analyses
As noted earlier, political efficacy was initially theorized as a unidimensional construct, but later refined to comprise two separate dimensions, internal political efficacy and external political efficacy (e.g., Balch, 1974). In line with the development of the construct, we tested the dimensionality of PESS with both a unidimensional and a two-dimensional confirmatory factor analysis model. Both models are considered to fit the data well if heuristics for model fit indices are met. We followed the heuristics of Hu and Bentler (1999), whereby a Comparative Fit Index (CFI) of around .950 (or higher), a Root Mean Square Error of Approximation (RMSEA) of .060 (or lower), and a Standardized Root Mean Square Residual (SRMR) of around .080 (or lower) imply a good model fit. Lower values of information criteria such as the Bayesian information criterion (BIC) point to a better model fit. We analyzed separate models for the UK and German data. For identification purposes, we fixed the latent variance(s) to one and the latent mean(s) to zero. We used robust maximum likelihood estimation (MLR) to fit the model.
When a unidimensional model was fit to the data, fit indices pointed to a poor model fit (UK/Germany: χ2(2) = 193.79/217.16, p < .001, CFI = .684/.588, RMSEA = .453/.476, SRMR = .139/.183, BIC = 5208/5120).[3] The findings showed that the factor structure was misspecified by assuming that only one factor lies behind the four items.
We further tested the assumption that two correlated factors (i.e., internal and external political efficacy) lay behind the four items. We tested two different versions of a two-factor model: one with freely estimated (i.e., congeneric) and one with fixed factor loadings (i.e., essentially tau-equivalent) across dimensions. Most fit indices of the congeneric model pointed to a good model fit in both nations (UK/Germany: χ2(1) = 11.35/24.76, p = .001/p < .001, CFI = .983/.955, RMSEA = .149/.224, SRMR = .012/.010, BIC = 4942/4782).[4] The same also applied to the essentially tau-equivalent model (UK/Germany: χ2(4) = 28.58/14.20, p < .001/p = .007, CFI = .959/.980, RMSEA = .115/.073, SRMR = .062/.069, BIC = 4940/4773).[5] Because the fit of the more constrained (i.e., essentially tau-equivalent) model was comparable with or even better than that of the less constrained (i.e., congeneric) model according to several fit indices (UK: RMSEA, BIC; Germany: χ2, CFI, RMSEA, BIC), we accepted the essentially tau-equivalent model in both nations (Figure 1). The empirical structure of PESS/PEKS confirmed the theoretical two-factor structure of political efficacy, thereby corroborating factorial validity.
Figure 1
Two-Factor Essentially Tau-Equivalent Measurement Model of PESS/PEKS with Standardized Coefficients
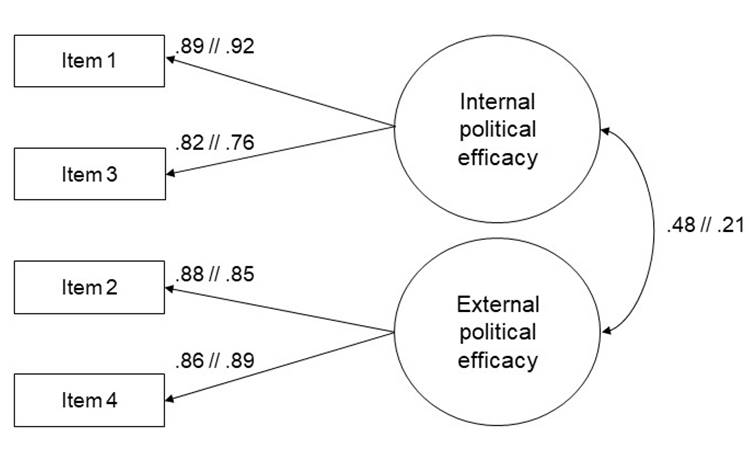
Note. The coefficients of the German sample follow those of the UK sample after the double slash. Item error terms have been omitted for clarity. NUK = 468; NDE = 474
In the essentially tau-equivalent model, internal and external political efficacy correlated at r = .47 (UK) and r = .21 (DE). This correlation can also be captured by a latent variable (with equal factor loadings on the factors of internal and external political efficacy). This so-called second-order factor model is equivalent to the model with two correlated factors. With a second-order factor model, the covariance between internal and external political efficacy can be used for further analysis. The correlation between the two factors is, however, often very small because the factors have different referents (oneself vs. politicians and political institutions; Craig & Maggiotto, 1982), and the correlation varies with regime type (Muller, 1970). Thus, we do not recommend using the total scale score across both factors. Unit-weighted mean scores should be computed separately for the subscales of political efficacy.[6]
Item parameter
Table 4 shows the mean, standard deviation, skewness, and kurtosis of each of the four items for PESS/PEKS separately for the UK and German samples.
Table 4
Descriptive Statistics for the PESS/PEKS Items by Nation
|
|
M |
SD |
Skewness |
Kurtosis |
||||
|
|
UK |
DE |
UK |
DE |
UK |
DE |
UK |
DE |
|
Item 1 |
3.05 |
3.42 |
1.10 |
0.99 |
−0.29 |
−0.46
|
−0.58 |
−0.06
|
|
Item 2 |
2.12 |
2.00 |
1.05 |
0.97 |
0.84 |
0.91
|
0.14
|
0.49
|
|
Item 3 |
2.83 |
3.23 |
1.24 |
1.21 |
0.08 |
−0.24 |
−0.96 |
−0.81 |
|
Item 4 |
2.08 |
1.98 |
1.07 |
0.93 |
0.82 |
0.82 |
−0.12 |
0.36 |
Note. UK = United Kingdom (N = 468); DE = Germany (N = 474).
[1] Our intention in choosing relatively liberal cutoff values was to avoid accidentally excluding valid cases and thereby creating a systematic bias in our data.
[2] The German-language source version of PESS has multiple indications of construct validity with political constructs such as political interest or political engagement (see Beierlein, Kemper, et al., 2014b). We did not validate PESS against other existing political efficacy scales or related constructs (e.g., political protest) because the validation of the English-language PESS was administered as part of a comprehensive online survey for the validation of various short scales. Therefore, there was no room for further validation scales. However, future research needs to address this point and survey PESS in combination with related/standard political efficacy scales and further political constructs.
[3] Taking the sample size into account prevents biased fit indices and yields the so-called robust CFI and robust RMSEA values in R/lavaan (Brosseau-Liard & Savalei, 2014; Brosseau-Liard et al., 2012): UK—robust CFI = .670, robust RMSEA = .547; DE—robust CFI = .539, robust RMSEA = .604.
[4] UK—robust CFI = .989, robust RMSEA = .142; DE—robust CFI = .994, robust RMSEA = .098.
[5] UK—robust CFI = .973, robust RMSEA = .112; DE—robust CFI = .987, robust RMSEA = .073.
[6] We suggest that individual answers should be aggregated to the subscale level only if there are no missing values on any of the two items. If there are missing values on one or more items, researchers should use appropriate methods for handling missing data, such as multiple imputation or full information maximum likelihood estimation.
In this study, we evaluated PESS, the English-language adaptation of PEKS, in the UK, and investigated its comparability with the German-language source version in Germany. We analyzed descriptive statistics and psychometric quality criteria—more precisely, objectivity, reliability, and validity—in both language versions. Moreover, we assessed test fairness across both nations with measurement invariance tests.
Objectivity
Researchers should be able to apply, evaluate, and interpret PESS/PEKS objectively. As PESS/PEKS contains fixed written instructions, a standardized order of the items, and a fixed number of labeled categories, it can be applied objectively. PESS/PEKS data can also be evaluated objectively because the scale is accompanied by strict rules on how to model it and how to build sum scores. PESS/PEKS can be interpreted objectively because reference values (i.e., descriptive statistics) have been provided.
Reliability
To estimate the reliability of the two PESS/PEKS subscales (internal and external political efficacy), we computed McDonald’s omega (McDonald, 1999; Raykov, 1997) and test–retest stability. McDonald’s omega was relatively high for both the UK and Germany (UK: ωInternal = .88, ωExternal = .84; DE: ωInternal = .86, ωExternal = .86). The test–retest stability (UK: rtt – Internal = .83, rtt – External = .68; DE: rtt – Internal = .87, rtt – External = .75) after approximately 3 to 4 weeks (MdnUK = 28 days; MdnDE = 20 days) was generally lower than McDonald’s omega in both nations, but it was still acceptable.
In sum, PESS/PEKS achieved internal consistencies and test–retest stabilities ranging from .68 to .88 in both nations. Especially in view of the fact that PESS/PEKS comprises only two items per subscale, these reliabilities are relatively high and are sufficient for research purposes (e.g., Aiken & Groth-Marnat, 2006; Kemper et al., 2019).
Validity
We investigated the nomological network of PESS/PEKS. As the nomological network was computed based on manifest correlations, the reported values represent lower-bound estimates of the true associations. The correlation coefficients are depicted in Table 5; their interpretation is based on Cohen (1992), who differentiated between a small (r ≥ .10), medium (r ≥ .30), and strong effect (r ≥ .50). Due to alpha accumulation through multiple testing, only coefficients with a significance level of p < .001 are interpreted (Table 5 displays unadjusted p values). In order to investigate the nomological network, we correlated PESS/PEKS with the constructs outlined in the Material section above.
As outlined in the Theoretical background section, internal political efficacy should be associated with personality (especially Big Five Openness and Extraversion; e.g., Vecchione & Caprara, 2009). In line with this expectation, we found that, in both nations, respondents who scored high in Openness and/or Extraversion (see also Beierlein, Kemper, et al., 2014b; Cooper et al., 2013; Vecchione & Caprara, 2009), and respondents who scored high in Emotional Stability (see also Beierlein, Kemper, et al., 2014b), had higher degrees of internal political efficacy. Conscientiousness was negatively related to internal political efficacy in Germany. External political efficacy was uncorrelated to (almost) all Big Five dimensions (see also Beierlein, Kemper, et al., 2014b).
We also assumed that political efficacy would be positively associated with general self-efficacy because it is a specific manifestation of this trait (Condon & Holleque, 2013). Our findings corroborated that expectation with respect to internal political efficacy (see also Beierlein, Kemper, et al., 2014b; Condon & Holleque, 2013). However, external political efficacy was unrelated to general self-efficacy (see also Beierlein, Kemper, et al., 2014b).
High political efficacy suggests a “feeling of mastery over political processes” (Shrivastava, 1989, p. 171; see also Minton, 1972). Thus, high internal political efficacy should be associated with a high internal locus of control. This expectation was corroborated by our data (see also Beierlein, Kemper, et al., 2014b; Sigel, 1975). Other associations differed across the two nations: Whereas internal political efficacy was positively related to external locus of control and external political efficacy was positively related to both internal and external locus of control in the UK, we did not find any associations between political efficacy and locus of control in Germany.
One might also suspect that optimism as a personality trait pervades people’s sense of (political) efficacy (e.g., Campbell et al., 1954, 1960; Shrivastava, 1989). In line with this reasoning, we found that, in both the UK and Germany, respondents with high internal political efficacy were more optimistic than those with low internal political efficacy. External political efficacy had no significant association with optimism.
Table 5
Correlations of Internal and External Political Efficacy with Relevant Variables in the UK and German Samples
Note. UK = United Kingdom (N = 468; NLeft–right self-placement = 325; NEmployment = 339; NIncome = 431); DE = Germany (N = 474; NLeft–right self-placement = 394; NEmployment = 309; NIncome = 449); CI = confidence interval; PQ+ = Exaggerating positive qualities; NQ‒ = Minimizing negative qualities. NQ‒ was recoded so that high scores on PQ+ and high scores on NQ‒ imply higher socially desirable responding. Optimism–pessimism: very pessimistic (1) – very optimistic (7). Employment: 1 = unemployed, 2 = employed. Gender: 1 = male, 2 = female. *p < .05, **p < .01, ***p < .001.
As outlined in the Theoretical background section, external political efficacy should correlate positively with trust (e.g., Balch, 1974; Craig, 1979; Niemi et al., 1991). We corroborated this finding in both nations. In contrast, internal political efficacy was positively related to interpersonal trust in the UK but not in Germany.
A high sense of political efficacy should be associated with high subjective well-being (e.g., Whiteley et al., 2010). In line with this assumption, we found that internal and external political efficacy were positively associated with life satisfaction (e.g., Whiteley et al., 2010).
Consistent with the findings of Beierlein, Kemper, et al. (2014b), internal and external political efficacy were independent of left–right self-placement (except for a positive correlation with external political efficacy in the UK).
In agreement with previous studies (e.g., Lane, 1955), internal political efficacy was uncorrelated with authoritarianism in both nations. Although external political efficacy was positively related to authoritarianism in the UK, we found no associations between the two variables in Germany (except for a positive association with the submissiveness subscale).
The correlational pattern of political efficacy with the four justice sensitivity subscales differed considerably across subscales and nations. In the UK, internal political efficacy correlated positively with observer, offender, and beneficiary sensitivity. External political efficacy correlated positively with offender and beneficiary sensitivity. We found no association between political efficacy and justice sensitivity in Germany.
Generally, people tend to bias their answers to self-efficacy questions to appear more favorable to others. In line with this observation, a high sense of (internal and external) political efficacy was related to the exaggeration of positive qualities but also to sincerity when answering items on negative qualities in the UK. In Germany, positive qualities were exaggerated when responding to the internal political efficacy items.
We also calculated correlations between political efficacy and relevant sociodemographic variables—namely employment, income, educational attainment, age, and gender. It has been consistently found that people with a high socioeconomic status have high levels of internal political efficacy (e.g., Beierlein, Kemper, et al., 2014b; Craig & Maggiotto, 1982; Morrell, 2003; Niemi et al., 1991). Our data support this finding: High internal political efficacy was associated with high income, high educational attainment, and male gender in both the UK and Germany, and with high age in Germany only. We further found barely any significant associations between external political efficacy and sociodemographic variables (except for a positive correlation with income in the UK and a negative correlation with age in Germany).
In sum, the pattern of correlations with relevant variables (i.e., the nomological network, see Table 5) confirms the validity of PESS/PEKS in both nations.
Descriptive statistics
Table 6 indicates the reference ranges in terms of means, standard deviations, skewness, and kurtosis of the two subscales of the PESS/PEKS for the total population, as well as separately for gender and age groups in both nations. Standard values are not available.
Table 6
Reference Ranges of the PESS/PEKS Scale Scores for the Total Population and Separately for Gender and Age Groups
|
|
M |
SD |
Skewness |
Kurtosis |
||||
|
|
UK |
DE |
UK |
DE |
UK |
DE |
UK |
DE |
|
Internal political efficacy |
|
|
|
|
|
|
|
|
|
Total population |
2.94 |
3.33 |
1.10 |
1.03 |
−0.13 |
−0.31 |
−0.76 |
−0.50 |
|
Male [nUK = 222; nDE = 237] |
3.15 |
3.53 |
1.03 |
0.96 |
−0.41 |
−0.52 |
−0.47 |
−0.20 |
|
Female [nUK = 246; nDE = 237] |
2.75 |
3.12 |
1.12 |
1.05 |
0.12 |
−0.10 |
−0.77 |
−0.59 |
|
18−29 [nUK = 104; nDE = 105] |
2.99 |
3.10 |
1.07 |
1.00 |
−0.18 |
0.05 |
−0.75 |
−0.74 |
|
30−49 [nUK = 180; nDE = 191] |
3.00 |
3.34 |
1.05 |
1.06 |
−0.23 |
−0.33 |
−0.75
|
−0.52
|
|
50−69 [nUK = 184; nDE = 178] |
2.85 |
3.45 |
1.15 |
0.99 |
0.00 |
−0.53 |
−0.81 |
−0.15 |
|
External political efficacy |
|
|
|
|
|
|
|
|
|
Total population |
2.10 |
1.99 |
0.99 |
0.89 |
0.80 |
0.87 |
−0.01 |
0.65 |
|
Male [nUK = 222; nDE = 237] |
2.15 |
2.01 |
1.03 |
0.89 |
0.68 |
0.75 |
−0.40 |
0.14 |
|
Female [nUK = 246; nDE = 237] |
2.06 |
1.97 |
0.95 |
0.88 |
0.92 |
0.99 |
0.42 |
1.17
|
|
18−29 [nUK = 104; nDE = 105] |
2.22 |
2.22 |
1.08 |
0.92 |
0.65 |
0.63 |
−0.40 |
0.08
|
|
30−49 [nUK = 180; nDE = 191] |
2.20 |
2.07 |
1.02 |
0.93 |
0.62 |
0.72 |
−0.48
|
0.16 |
|
50−69 [nUK = 184; nDE = 178] |
1.95 |
1.78 |
0.88 |
0.76 |
1.04 |
1.17 |
0.90 |
2.17 |
Note. UK = United Kingdom (N = 468); DE = Germany (N = 474).
Further quality criteria
Due to its short completion time (< 30 s), the PESS/PEKS can be seen as economic.
To investigate to what degree the PESS/PEKS subscales were measurement invariant across the UK and Germany, we estimated multigroup confirmatory factor analysis models (Vandenberg & Lance, 2000; Widaman & Reise, 1997). We tested four successive levels of measurement invariance: configural invariance (same measurement model), metric invariance (same loadings), scalar invariance (same intercepts), and uniqueness invariance (same residual variances). To decide on the achieved level of measurement invariance, we applied Chen’s (2007) cutoff criteria for changes in fit indices. When examining global fit indices, we again applied Hu and Bentler’s (1999) cutoff criteria. We tested measurement invariance based on the essentially tau-equivalent model. For identification purposes, we fixed the first loading and intercept of each factor to one. Due to the identification strategy and our basic model, the configural model equals the metric model. We used MLR estimation to fit the model.
According to these heuristics, the metric model fit quite well (χ2(6) = 30.73, p < .001, CFI = .978, RMSEA = .094, SRMR = .024, BIC = 9729), although the RMSEA was clearly too large. Because the other fit indices pointed to a good model fit, and further modification were not theoretically justified, we accepted the metric model. Thus, latent variances and covariances can be compared across nations (e.g., Bluemke et al., 2016). The scalar model also fit well (χ2(8) = 30.89, p < .001, CFI = .980, RMSEA = .078, SRMR = .024, BIC = 9716). When comparing the scalar with the metric model (Δχ2(2) = 0.44, p = .804, ΔCFI = .002, ΔRMSEA = − .016, ΔSRMR = .000, ΔBIC = − 13), we could accept it according to Chen’s (2007) cutoff values. We even found a lower RMSEA for the scalar compared to the metric model. Scalar invariance implies that latent means additional to latent variance and covariances can be compared across the UK and Germany (e.g., Bluemke et al., 2016). We also accepted the uniqueness model because the global model fit quite well (χ2(12) = 32.28, p < .001, CFI = .978, RMSEA = .067, SRMR = .032, BIC = 9702)[7] and the misspecification induced when restricting the residual variances was negligible (Δχ2(4) = 8.59, p = .072, ΔCFI = − .002, ΔRMSEA = − .011, ΔSRMR = .008, ΔBIC = − 14). Uniqueness invariance implies that researchers working with PESS/PEKS can compare manifest scale scores (means and variances) and correlations across language groups without systematic bias (e.g., Bluemke et al., 2016).
Further literature
The scale was first published in the journal Measurement Instruments for the Social Sciences.
Acknowledgement
We would like to thank Melanie Partsch from GESIS – Leibniz Institute for the Social Sciences for preparing the data. The study was funded by an internal grant provided by GESIS – Leibniz Institute for the Social Sciences, Mannheim, Germany.
[7] Metric—robust CFI = .985, robust RMSEA = .092; scalar—robust CFI = .986, robust RMSEA = .077; uniqueness—robust CFI = .982, robust RMSEA = .072.
Groskurth, K., Nießen, D., Rammstedt, B., & Lechner, C. M.