General Self-Efficacy Short Scale-3 (GSE-3)
Autor/in:
Doll, E. S., Nießen, D., Schmidt, I., Rammstedt, B., & Lechner, C. M.
In ZIS seit:
2021
Downloads
Aktionen
Nutzungsbedingungen
Zur Nutzung für andere Zwecke kontaktieren Sie die Autor*innen
Zusammenfassung:
Abstract:
General self-efficacy describes the global confidence in one's own competence and is relevant for a variety of settings, such as health-related, social, and motivational contexts. The General Self-Efficacy Short Scale3 (GSE-3) the English-language adaptation of the German-language scale Allgemeine Selbstwirksamkeit Kurzskala (ASKU; Beierlein, Kovaleva, et al., 2014) enables to measure GSE with only three items in a very economical way. The scale further meets excellent quality criteria, such as objectivity, reliability, factorial, and construct validity, and scalar measurement invariance holds across the UK and Germany. GSE-3 is particularly suitable to be applied in large social science surveys.
Sprache Dokumentation:
English
Sprache Items:
English, German (source)
Anzahl der Items:
3
Erhebungsmodus:
Survey Mode: CASI
Bearbeitungszeit:
< 30 s
Reliabilität:
McDonald's omega = .91; retest reliability = .71
Validität:
evidence for factorial, construct, and criterion validity
Konstrukt:
general self-efficacy
Schlagwörter:
general self-efficacy, self-concept, competence
Item(s) in Bevölkerungsumfrage eingesetzt:
yes
Skalenentwicklung:
<p>Eine Studie von Décieux und Kollegen (2019) liefert zusätzliche Informationen zur deutschsprachigen Version der General Self-Efficacy Short Scale-3 (GSE-3), auch bekannt als ASKU. Die Reliabilität der Skala wurde mit (α = .80, ω = .80) berichtet. Die Autoren berichteten zudem CFA-Ergebnisse, die eine Ein-Faktor-Struktur unterstützten. Die skalare Invarianz wurde für die deutschen und französischen Versionen bestätigt. In der kombinierten französischen und deutschen Stichprobe zeigte sich ein kleiner Zusammenhang zwischen hohen Werten und dem männlichen Geschlecht (r = -.08), mit zunehmendem Alter (r = .06) sowie mit einer positiven Bewertung des Arbeitsklimas (r = .11). Zudem bestand eine starke positive Beziehung zur internen Kontrollüberzeugung (r = .44) und eine schwache negative Beziehung zur externen Kontrollüberzeugung (r = -.09) sowie zum öffentlichen Engagement (r = -.13). Alle signifikanten Korrelationen stimmen mit der bestehenden Literatur zu diesem Konstrukt überein. Die Stichprobe bestand aus 658 deutschsprachigen Jugendlichen und jungen Erwachsenen (15 - 35 Jahre) in Luxemburg. Zusätzlich wurden die Daten von 658 französischsprachigen Teilnehmern in die Korrelationen einbezogen. Weitere Informationen finden Sie unter <a href="https://doi.org/10.1024/1421-0185/a000233" target="_blank" rel="noopener">https://doi.org/10.1024/1421-0185/a000233</a>. </p>
Instruction
The following statements may more apply more or less to you. To what extent do you think each statement applies to you personally?
Items
Table 1
Items of the General Self-Efficacy Short Scale–3 (GSE-3)
|
No. |
Item |
|
1 |
I can rely on my own abilities in difficult situations. |
|
2 |
I am able to solve most problems on my own. |
|
3 |
I can usually solve even challenging and complex tasks well. |
Response specifications
Items are answered on a fully labelled 5-point rating scale, comprising the categories 1 = does not apply at all, 2 = applies a bit, 3 = applies somewhat , 4 = applies mostly, and 5 = applies completely.
Scoring
The scale score of general self-efficacy is calculated as the unweighted mean across the three GSE-3 items shown in Table 1. We suggest this aggregation only if there are no missing values on any of the three items. In case of missing values, we recommend using multiple imputation (e.g., Baraldi & Enders, 2013) or computing model-based composite scores in a structural equation model (SEM) using full-information maximum likelihood estimation (FIML) as described by Rose et al. (2019). Instead of computing manifest scale scores, the three items can also be used to model a latent “self-efficacy” variable that is free of measurement error, as described in the section Scale development.
Application field
With a completion time of < 30 s (estimated value), GSE-3 is a highly economical scale and particularly suitable for an efficient measurement of general self-efficacy in English-speaking samples in social science surveys. GSE-3 is an English-language adaptation of the German-language scale “Allgemeine Selbstwirksamkeit Kurzskala” (ASKU; Beierlein, Kovaleva, et al., 2014). Scalar measurement invariance across the UK and Germany enables a comparable interpretation of latent scale scores across these two countries. GSE-3 can be used in different survey modes such as computer-assisted in online surveys, paper-pencil-based (both self-administered), or in face-to-face interviews. Within the scope of this validation study, the scale was tested in computer-assisted self-administered interviewing.
The concept of self-efficacy was first introduced by Albert Bandura (1977) in his social cognitive theory (SCT). It is defined as the confidence in one’s own abilities to master particular challenging situations. Thus, self-efficacy was initially understood as a situation-specific judgment. Consistent with this conceptualization, later research often investigated domain-specific manifestations of self-efficacy in different areas of life, such as educational (e.g., Gresham et al., 1988), health-related (e.g., Schwarzer & Renner, 2009), occupational (e.g., Schyns & Collani, 1999), political (e.g., Beierlein, Kovaleva, et al., 2014), and social contexts (e.g., Gresham et al., 1988). Contrary to this domain-specific conceptualization, another branch of research has developed that investigates general self-efficacy (GSE), to which the present research work refers. This research was motivated by the observation that measures of self-efficacy correlate highly across different life domains or situations, suggesting the existence of a general, cross-domain self-efficacy factor. Accordingly, GSE describes an individual’s belief to be able to accomplish new tasks and challenges and to cope with adversity and setbacks across many areas (Schwarzer & Jerusalem, 1995b). It is therefore considered as the general confidence in one’s own competence and reflects a broad and mainly stable personality trait instead of a situation-specific judgment. According to Shelton (1990), an individual’s GSE could be the result of an attributional process of averaging past personal successes and failures, and subsequently assigning them to the self. She suggested that high GSE might arise from a high degree of appreciation for success that outweighs the blame for failure. Consequently, highly self-efficacious individuals should generally show mastery-oriented attitudes when facing challenges (Hsieh, 2011). In turn, lower GSE could be based on higher self-blame for failure rather than credits for appreciated success, generating a helpless attitude toward life challenges (Shelton, 1999).
This understanding of the construct implies that GSE plays an important role in dealing with crises. Nevertheless, it is also highly relevant in a wide range of other areas of life, rendering it an important construct for a variety of research questions. For example, the relevance of GSE to health has been widely studied. Thereby, positive connections were found with health-related locus of control (e.g., Lau-Walker, 2004; Roddenberry & Renk, 2010), mental health (e.g., Bavojdan et al., 2011), and optimistic attitudes towards one’s own medical status (e.g., Lau-Walker, 2004). In addition, GSE correlates negatively with mortality (Assari, 2017), depression and anxiety (e.g., Schwarzer, 1997, Roddenberry & Renk, 2010), physical symptoms (Roddenberry & Renk, 2010), general and academic stress (Roddenberry & Renk, 2010) as well as with the appraisal of stressful situations as challenges (Luszczynska et al., 2005). Beyond that, there are connections between GSE and further indicators of well-being, such as life satisfaction (e.g., Beierlein, Kovaleva, et al., 2014; Luszczynska et al., 2005), optimism (e.g., Beierlein, Kovaleva, et al., 2014; Luszczynska et al., 2005), quality of life (e.g., Luszczynska et al., 2005), and positive affect (e.g., Luszczynska et al., 2005). In addition, social-life-related aspects has been shown to be associated with GSE, for example, interpersonal competency (e.g., Sherer et al., 1982) and quality of social life (e.g., Luszczynska et al., 2005). The significance of GSE has been further highlighted by correlations between GSE and motivational processes (Luszczynska et al., 2005), achievement (Luszczynska et al., 2005), and task performance (Howard, 2019).
Because of its high relevance in everyday and crisis situations, different scales for measuring GSE have been developed. The first scale was introduced by Sherer and colleagues (1982). They created a scale consisting of a total of 23 items; 17 items loaded on the factor general self-efficacy and six items on the factor social self-efficacy. A single-factor solution was developed by Schwarzer and Jerusalem (1999); their originally German-language scale “Skala zur Allgemeinen Selbstwirksamkeitserwartung [Scale for General Self-Efficacy Expectation] (SWE)” contained only 10 items and was validated in 28 languages. Based on this 10-item scale, Beierlein, Kovaleva, and colleagues (2014) developed the German-language ultra-short scale ASKU with optimized items that measures GSE efficiently and that is particularly suitable for large-scale surveys.
Item generation and selection
In the construction process, Beierlein, Kovaleva, et al. (2014) initially selected seven items from Schwarzer and Jerusalem’s (1999) 10-item scale on the basis of their item characteristics and their factor loadings. To increase the clarity of the selected items, in a second step, the authors modified some item wordings. They additionally changed the response format from a 4- to a 5-point format in order to ensure sufficient differentiation at the top end of the scale and again modified the items after conducting a cognitive pretest (Prüfer & Porst, 2010). In a third step, they selected three items for the final version of the ultra-short scale, whose quality they evaluated based on three large samples, including two quota samples and one random sample (N’s = 539 to 1,134). Beyond that, the originally German-language short scale was adapted into English via a two-step procedure following the TRAPD approach (Translation, Review, Adjudication, Pretesting, and Documentation; Harkness, 2003): First, two professional native-speaking translators proposed English-item formulations independently of each other into British English and American English, respectively. Then, a group of psychometric experts, the translators, and another expert in questionnaire translation held an adjudication meeting to discuss and review the translation proposals leading to a final solution.
However, the English items have not yet been tested empirically. The aim of the present study was to investigate the psychometric properties of the English-language adaptation GSE-3 and compare its psychometric properties with those of the original German-language source version ASKU (Beierlein, Kovaleva, et al., 2014) using UK and German quota samples.
Samples
To investigate the psychometric properties of GSE-3, and their comparability with those of the German-language source instrument, we assessed both versions in a web-based survey (using computer-assisted self-administered interviewing [CASI]) conducted in the UK and Germany (DE) by the online access panel provider respondi AG. The study took place in January 2018. For the UK and Germany, quota samples were drawn that represented the heterogeneity of the adult population with regard to age, gender, and educational attainment. Only native speakers of the respective languages were recruited. We explained our research goal (investigation of the quality of several questionnaires) to the participants. Respondents were financially rewarded for their participation. In both countries, a subsample was reassessed after approximately 3 to 4 weeks (MdnUK = 28 days; MdnDE = 20 days).
We included only respondents who completed the full questionnaire—that is, who did not abort the survey prematurely—in our analyses. To handle missing values on single items, we used FIML. This yielded gross samples of NUK = 508 and NDE 513. In the next step, invalid cases were excluded based on (a) ipsatized variance—that is, the within-person variance across items (Kemper & Menold, 2014)—if the person fell within the lower 5% of the sample distribution of ipsatized variance; (b) the Mahalanobis distance of a person’s response vector from the average sample response vector (Meade & Craig, 2012) if the person fell within the upper 2.5% of the sample distribution of the Mahalanobis distance; and (c) response time if the person took, on average, less than 1 s to respond to an item. Our intention in choosing relatively liberal cut-off values was to avoid accidentally excluding valid cases and thereby creating a systematic bias in our data. The outlined approach resulted in a total exclusion of 7.9% cases in the UK subsample and 7.6% cases in the German subsample, yielding net sample sizes of NUK = 468 (retest: NUK = 111) and NDE = 474 (retest: NDE = 117). Table 2 depicts in detail the sample characteristics and their distribution.
Table 2
Sample Characteristic Features
|
|
United Kingdom |
Germany |
|
N |
468 |
474 |
|
Mean age in years (SD) [Range] |
45.2 (14.5) [18–69] |
44.0 (14.4) [18–69] |
|
Proportion of women (%) |
52.6 |
50.0 |
|
Educational level (%) |
|
|
|
Low: never went to school, Skills for Life/1–4 GCSEs A*–C or equivalent |
34.8 |
33.5 |
|
Intermediate: 5 or more GCSEs A*–C/vocational GCSE/GNVQ intermediate or equivalent |
32.1 |
33.8 |
|
High: 2 or more A-levels or equivalent |
33.1 |
32.7 |
Note. The equivalent German educational levels were as follows (from low to high): ohne Bildungsabschluss/Hauptschule [no educational qualification; lower secondary leaving certificate]; mittlerer Schulabschluss [intermediate school leaving certificate]; (Fach-)Hochschulreife [higher education entrance qualification].
Material
Besides the respective language version of GSE-3/ASKU, the online survey further comprised variables measuring (a) the individuals’ subjective general health status, (b) life satisfaction, (c) optimism, (d) the Big Five dimensions of personality, (e) self-esteem, (f) locus of control, (g) impulsive behavior (urgency, premeditation, perseverance, sensation seeking), (h) risk-taking, (i) external and internal political efficacy, (j) interpersonal trust, and (k) social desirability. In addition, the sociodemographic variables employment status, income, educational level, age, and gender were part of the survey. Therefore, we used the following short scales in the respective respondents’ mother tongue (English for the UK sample and German for the German sample):
(a) the item How is your health in general? Would you say it is very good / good / fair / bad / very bad? used in the European Social Survey (ESS, 2016)
(b) the General Life Satisfaction Short Scale (L-1; Nießen; Groskurth, et al., 2020a; German version: Kurzskala zur Erfassung der Allgemeinen Lebenszufriedenheit; Beierlein, Kovaleva, László, et al., 2015)
(c) the Optimism–Pessimism Short Scale–2 (SOP2; Nießen, Groskurth, et al., 2022 ; German version: Skala Optimismus-Pessimismus-2; Kemper, Beierlein, Kovaleva, et al, 2014)
(d) the extra-short form of the Big Five Inventory–2 (BFI-2-XS; English version: Soto & John, 2017; German version: Rammstedt et al., 2020)
(e) the Rosenberg Self-Esteem Scale (RSES; Rosenberg, 2014; German version: von Collani & Herzberg, 2003)
(f) the Internal–External Locus of Control Short Scale–4 (IE-4; Nießen, Schmidt, et al., 2022; German version: Internale-Externale-Kontrollüberzeugung–4; Kovaleva et al., 2014b).
(g) the Impulsive Behavior Short Scale–8 (I-8; Groskurth et al., 2022 ; German version: Skala Impulsives-Verhalten-8; Kovaleva et al., 2014a)
(h) the Risk Proneness Short Scale (R-1; Nießen, Groskurth, et al., 2020b; German version: Kurzskala zur Erfassung der Risikobereitschaft; Beierlein, Kovaleva, Kemper, & Rammstedt, 2015)
(i) the Political Efficacy Short Scale (PESS; Groskurth et al., 2021b; German version: Political Efficacy Kurzskala: PEKS; Beierlein, Kemper, et al., 2014b)
(j) the Interpersonal Trust Short Scale (KUSIV3; Nießen, Beierlein, et al., 2020; German version: Kurzskala Interpersonelles Vertrauen; Beierlein, Kemper, et al., 2014a)
(k) the Social Desirability–Gamma Short Scale (KSE-G; Nießen et al., 2019; German version: Kurzskala Soziale Erwünschtheit–Gamma; Kemper, Beierlein, Bensch, et al., 2014)
Item analyses
We conducted SEM in R (package lavaan) to investigate the factorial structure of GSE-3. We ran the analyses separately for the UK and the German sample using maximum likelihood with robust standard errors (MLR) as estimation method. The syntax for all analyses can be found in the Appendix. Because a model with three items is just identified (zero degrees of freedom), we could not evaluate the fit of the tau-congeneric measurement model without further constraints. However, as illustrated in Figure 1, the standardized factor loadings were all above .80 and therefore serve as suitable indicators that the items adequately represent the underlying latent variable. Because there is no a priori reason to assume that the three items would vary in how well they measure the latent variable (GSE), we next estimated an essentially tau-equivalent measurement model in which the three loadings were constrained to equality within each country. These additional constraints allowed us to assess model fit. We further estimated a tau-equivalent and a parallel test measurement model. Table 3 shows the parameters of all calculated measurement models. As can be seen from the table, the essentially tau-equivalent model showed excellent fit according to the criteria of Hu and Bentler (1999); the tau-equivalent and the parallel test model did not meet the criteria. We therefore accepted the essentially tau-equivalent measurement model. It allows us to assume unidimensionality of GSE-3, thereby supporting the factorial validity of our scale.
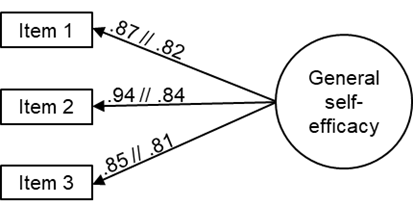
Figure 1. Essentially tau-equivalent measurement model for general self-efficacy measured by GSE-3. The standardized path coefficients are given, with those of the English sample preceding and the German sample following the double slash. Item error terms are omitted for clarity. UK: N = 468; Germany; N = 474.
Table 3
Parameters for the Four Tested Measurement Models for GSE-3 for the UK and Germany
|
Tau-congeneric |
Essentially tau-equivalent |
Tau-equivalent |
Parallel test |
|||||
|
UK |
DE |
UK |
DE |
UK |
DE |
UK |
DE |
|
|
df |
0 |
0 |
2 |
2 |
4 |
4 |
6 |
6 |
|
χ² |
.000 |
.000 |
0.852 |
.626 |
32.921 |
2.087 |
98.683 |
19.815 |
|
p |
<.001 |
<.001 |
.653 |
.731 |
<.001 |
.720 |
<.001 |
.003 |
|
CFI |
1.000 |
1.000 |
1.000 |
1.000 |
.931 |
1.000 |
.778 |
.956 |
|
RMSEA |
.000 |
.000 |
.000 |
.000 |
.124 |
.000 |
.182 |
.070 |
|
SRMR |
.000 |
.000 |
.014 |
.013 |
.045 |
.028 |
.082 |
.051 |
|
BIC |
3066.81 |
2606.04 |
3055.54 |
2594.48 |
3093.74 |
2584.62 |
3167.83 |
2596.27 |
Note. UK = United Kingdom (N = 468); DE = Germany (N = 474). We identified our model by fixing the first factor variance to 1 and the factor mean to 0.
Item parameters
Table 4 shows the descriptive statistics (M, SD, skewness, kurtosis, and selectivity) for the three GSE-3 items. The inter-item correlations, all significant on the p < .001 level, can be found in Table 5. In both cases, the parameters are presented separately for the UK and the German sample. The averages for the three items were all above the midpoint of the response scale (2.5).
Table 4
Descriptive Statistics, Skewness, Kurtosis, and Selectivity for the GSE-3 Items
|
|
M |
SD |
Skewness |
Kurtosis |
Selectivity |
|||||
|
|
UK |
DE |
UK |
DE |
UK |
DE |
UK |
DE |
UK |
DE |
|
Item 1 |
3.89 |
4.03 |
1.04 |
0.76 |
−0.77 |
−0.69 |
−0.21 |
0.82 |
0.82 |
0.74 |
|
Item 2 |
3.85 |
4.03 |
0.97 |
0.73 |
−0.80 |
−0.74 |
0.19 |
1.26 |
0.87 |
0.74 |
|
Item 3 |
3.62 |
3.91 |
1.06 |
0.77 |
−0.54 |
−0.38 |
−0.41 |
−0.16 |
0.80 |
0.74 |
Note. UK = United Kingdom (N = 468); DE = Germany (N = 474).
Table 5
Inter-Item Correlations of GSE-3
|
|
Item 1 |
Item 2 |
||
|
UK |
DE |
UK |
DE |
|
|
Item 2 |
.83 |
.68 |
- |
- |
|
Item 3 |
.73 |
.68 |
.80 |
.68 |
Note. UK = United Kingdom (N = 468); DE = Germany (N = 474).
Objectivity
GSE-3 meets the requirements of objectivity through the standardized questionnaire format and instructions (objectivity of application), the specified and fully labelled response categories (objectivity of evaluation), and the reference ranges (objectivity of interpretation).
Reliability
To evaluate the reliability of GSE-3, we calculated McDonald’s omega (McDonald, 1999; Raykov, 1997) based on the essentially tau-equivalent model, and test–retest stability over approximately a 3 to 4-week period separately for the UK and the German sample (see Table 6). For both samples, the reliability coefficients were acceptable to excellent, with the English-language version of the scale overall appearing to be slightly more reliable than the German-language version. In particular, internal consistency—and here especially for the English-language version—proved to be very good.
Table 6
Coefficients of Scale Reliability for GSE-3
|
|
UK |
DE |
UK |
DE |
||||
|
ω |
ω |
rtt |
CI95% |
rtt |
CI95% |
|||
|
General self-efficacy |
.92 |
.86 |
.71 |
[.60, .79] |
.65 |
[.53, .74] |
||
Note. UK = United Kingdom (N = 468; retest: N = 111); DE = Germany (N = 474; retest: N = 117). The retest was conducted 3 to 4 weeks after the main survey (MdnUK = 28 days; MdnDE = 20 days).
Validity
To validate GSE-3, we assessed its factorial and construct validity. Furthermore, content-related validity of GSE-3 can be inferred from the development process of the original German-language scale by Beierlein, Kovaleva, et al. (2014), in which the item formulation was closely aligned to the construct definition and optimized through expert reviews and a cognitive pretest.
Factorial validity
With standardized loadings of λ ≥ .82 on a single latent factor across both samples, there is evidence for factorial validity. Additionally, an essentially tau-equivalent model showed good fit in both countries. As this is consistent with the assumptions about the dimensional structure of GSE-3, we could assume factorial validity.
Construct validity
We analysed manifest correlations between GSE-3 and relevant variables introduced in the Material section and shown in Table 7. To interpret the correlation coefficients, we referred to the effect size guidelines of Gignac and Szodorai (2016).[1]
According to Bandura (1977), self-efficacy represents optimistic and prospective self-beliefs that are protective and positively related to life satisfaction. Supporting these assumptions, previous research has found positive correlations between self-efficacy and individual health (e.g., Roddenberry & Renk, 2010), optimism (e.g., Beierlein, Kovaleva, et al., 2014; Luszczynska et al., 2005), and life satisfaction (e.g., Beierlein, Kovaleva, et al., 2014; Luszczynska et al., 2005). In our study, we could replicate these findings in both samples.
A closely related concept of GSE is self-esteem. It is supposed that beliefs about one’s abilities (GSE) contribute to self-esteem, which represents a fundamental attitude towards oneself (Sherer et al., 1982). Accordingly, previous research has reported that highly self-efficacious individuals are more likely to show higher levels of self-esteem (e.g., Beierlein, Kovaleva, et al., 2014; Luszczynska et al., 2005; Sherer et al., 1982). Our findings confirmed these results for both samples.
Bandura (1977) further proposed that self-efficacy beliefs can be enhanced if individuals attribute their successes to skill (internally) and not to luck or chance (externally). Indeed, previous work has found medium-to-large positive correlations with internal locus of control and medium negative correlations with external locus of control (e.g., Beierlein, Kovaleva, et al., 2014; Roddenberry & Renk, 2010; Sherer et al., 1982). In this study, we could replicate this correlation with internal locus of control in both samples. The expected negative correlation with external locus of control was only found in the German sample—in line with the results of Beierlein, Kovaleva, and colleagues (2014)—but it was not significant in the UK sample.
The relationship between GSE and the Big Five dimensions has also been investigated many times. Frequently observed patterns have been medium-to-large correlations with Emotional Stability (e.g., Beierlein, Kovaleva, et al., 2014; Judge et al., 2002; Wang et al., 2014), and small-to-medium correlations with Extraversion (e.g., Beierlein, Kovaleva, et al., 2014; Schwarzer et al., 2007; Wang et al., 2014), Openness (e.g., Beierlein, Kovaleva, et al., 2014; Wang et al., 2014), and Conscientiousness (e.g., Beierlein, Kovaleva, et al., 2014; Wang et al., 2014). Concerning Agreeableness, both positive correlations (e.g., Wang et al., 2014) and non-significant correlations (e.g., Beierlein, Kovaleva, et al., 2014) has been found. Our findings reflected the same pattern, with inconsistent findings for Agreeableness for the UK and the German sample.
Supporting Sherer et al.’s idea (1982) that the general belief in one's competence is seen by others as a positive characteristic, we further found positive correlations between GSE and socially desirable responding—but only for the subdimension “exaggerating positive qualities”, which depicts the self-deceptive enhancement component of communion-induced socially desirable responding (Nießen et al., 2019).
Correlations with sociodemographic variables
We found small-to-medium positive correlations with income and educational level for both countries, and with employment status for the German sample. Our results are consistent with previous research findings (e.g., Beierlein, Kovaleva et al., 2014; Sherer et al., 1982; Tong & Song, 2004). They can be explained by the fact that the level of GSE is formed by attributions of success and failure to the self (Shelton, 1990). Hence, continuous successes in educational and professional contexts may have led to higher academic achievement and income, and thus contributing to greater GSE.
Taken together, manifold correlations with related constructs indicated good construct validity for GSE-3. They also corresponded to the original German-language scale by Beierlein, Kovaleva, et al. (2014).
Table 7
Correlations of GSE-3 With Relevant Variables
|
|
UK |
DE |
||
|
|
r |
CI95% |
r |
CI95% |
|
Healtha |
.21 |
[.13, .30] |
.28 |
[.20, .37] |
|
Life satisfaction |
.24 |
[.16, .33] |
.35 |
[.27, .43] |
|
Optimism |
.31 |
[.22, .39] |
.36 |
[.28, .43] |
|
Big Five |
||||
|
Extraversion |
.32 |
[.24, .40] |
.24 |
[.15, .32] |
|
Agreeableness |
.05 |
[−.04, .14] |
.20 |
[.11, .29] |
|
Conscientiousness |
.23 |
[.14, .32] |
.30 |
[.21, .38] |
|
Emotional Stability |
.33 |
[.25, .41] |
.40 |
[.32, .47] |
|
Openness |
.32 |
[.24, .40] |
.28 |
[.20, .37] |
|
Self-esteemb |
.34 |
[.25, .41] |
.48 |
[.41, .55] |
|
Locus of control |
||||
|
Internal |
.38 |
[.30, .45] |
.51 |
[.44, .57] |
|
External |
−.01 |
[−.10, .08] |
−.22 |
[−.31, −.14] |
|
Impulsive behavior |
||||
|
Urgency |
.01 |
[−.08, .10] |
−.09 |
[−.18, .00] |
|
Premeditation |
.36 |
[.28, .44] |
.31 |
[.22, .39] |
|
Perseverance |
.43 |
[.35, .50] |
.43 |
[.35, .50] |
|
Sensation seeking |
.33 |
[.25, .41] |
.30 |
[.22, .38] |
|
Risk-taking |
.24 |
[.15, .32] |
.24 |
[.15, .32] |
|
Political efficacy |
||||
|
Internal |
.32 |
[.24, .40] |
.41 |
[.33, .48] |
|
External |
.09 |
[−.00, .18] |
.09 |
[.00, .18] |
|
Interpersonal trust |
.10 |
[.01, .19] |
.17 |
[.08, .26] |
|
Social desirability |
||||
|
PQ+ |
.31 |
[.22, .39] |
.33 |
[.25, .41] |
|
NQ− |
.09 |
[.00, .18] |
−.09 |
[−.18, .00] |
|
Sociodemographics |
||||
|
Employment Status |
|
|
|
|
|
Employed (reference category) |
||||
|
Unemployed |
−.11 |
[−.21, .00] |
−.19 |
[−.29, −.08] |
|
Self-employed |
−.10 |
[−.22, .01] |
.09 |
[−.02, .20] |
|
Retired/doing housework |
−.04 |
[−.14, .07] |
−.18 |
[−.28, −.09] |
|
Pupil/ student/ apprentice/ internship |
.04 |
[−.07, .16] |
−.06 |
[−.17, .04] |
|
Income |
.28 |
[.19, .36] |
.28 |
[.19, .36] |
|
Educational level |
.18 |
[.09, .26] |
.22 |
[.13, .30] |
|
Age |
−.06 |
[−.15, .03] |
.03 |
[−.06, .12] |
|
Gender |
−.10 |
[−.19, −.01] |
−.05 |
[−.13, .04] |
Note. UK = United Kingdom (N = 468; NEmployment status = 450; NIncome = 431); DE = Germany (N = 474; NEmployment status = 462; NIncome = 449); CI = confidence interval; PQ+ = exaggerating positive qualities; NQ− = minimizing negative qualities. Gender: 1 = male, 2 = female. Coefficients above .20 are in bold type, because they exceed an effect size that can be considered as relevant (Gignac & Szodorai, 2016).
a Because the variable health was poled negatively, it was recoded prior to the analyses.
b Because the variable self-esteem was poled negatively in the UK sample, it was recoded prior to the analyses.
Descriptive statistics
We calculated descriptive statistics (reference values) based on the UK and the German samples for the total scale and separately for gender and age groups (18−29 years, 30−49 years, 50−69 years). As it can be seen from Table 8, the mean values are all clearly above the midpoint of the response scale (2.5). Standard values are not available.
Table 8
Reference Values of the GSE-3 Scale Scores for the UK and Germany for the Total Population and Separately for Gender and Age Groups
|
|
M |
SD |
Skewness |
Kurtosis |
||||
|
|
UK |
DE |
UK |
DE |
UK |
DE |
UK |
DE |
|
Total population |
3.78 |
3.99 |
0.94 |
0.67 |
−0.71 |
−0.50 |
−0.18 |
0.56 |
|
Male [nUK = 222; nDE = 237] |
3.89 |
4.02 |
0.95 |
0.60 |
−0.89 |
−0.28 |
0.08 |
0.31 |
|
Female [nUK = 246; nDE = 237] |
3.69 |
3.96 |
0.93 |
0.72 |
−0.56 |
−0.57 |
−0.31 |
0.43 |
|
18−29 [nUK = 104; nDE = 105] |
3.95 |
3.93 |
0.88 |
0.63 |
−0.81 |
−0.78 |
−0.09 |
0.95 |
|
30−49 [nUK = 180; nDE = 191] |
3.74 |
4.06 |
0.97 |
0.71 |
−0.76 |
−0.70 |
0.12 |
0.74 |
|
50−69 [nUK = 184; nDE = 178] |
3.73 |
3.96 |
0.95 |
0.64 |
−0.57 |
−0.12 |
−0.64 |
0.06 |
Note. UK = United Kingdom (N = 468); DE = Germany (N = 474).
Further quality criteria
Economy
The processing time of GSE-3 of about 30 s indicates a highly economical scale.
Measurement invariance
Table 9
Results of the Multi-Group Confirmatory Factor Analysis (MG-CFA) Based on the Essentially Tau-Equivalent Model to Evaluate Measurement Invariance Across the UK and Germany
|
Model |
df |
χ² |
p |
CFI |
RMSEA |
SRMR |
BIC |
|
Configural |
4 |
1.48 |
.831 |
1.000 |
.000 |
.013 |
5659.72 |
|
Metric |
4 |
1.48 |
.831 |
1.000 |
.000 |
.013 |
5659.72 |
|
Scalar |
6 |
12.93 |
.044 |
.991 |
.050 |
.025 |
5659.01 |
Note. UK = United Kingdom (N = 468); DE = Germany (N = 474).
The measurement invariance of GSE-3 across the UK and Germany was examined with a multi-group confirmatory factor analysis (MG-CFA) to evaluate measurement invariance (Vandenberg & Lance, 2000; Widaman & Reise, 1997). We used the essentially tau-equivalent measurement model as basis and interpreted the results according to the cut-off values recommended by Chen (2007) and by comparing the BIC values. We identified our model by fixing the first factor variance to 1 and the factor mean to 0. The results for the models are presented in Table 9. Due to our identification method and the tau-equivalent model, the configural and the metric model were identical. They both showed good fit, so that we could assume metric measurement invariance across the UK and the German sample. For the scalar model, ΔCFI showed good model fit, whereas the fit indices for ΔRMSEA and ΔSRMR were higher than the cut-off values recommended by Chen (2007). According to Chen (2007), ΔCFI and either ΔSRMR or ΔRMSEA should not exceed the cut-off values in order to assume scalar invariance. Because ΔCFI was good and ΔSRMR exceeded the cut off-value only slightly, we additionally include the BIC values as criterion, with lower BIC values indicating a better model. This also supports the more restrictive scalar model. Furthermore, the scalar model showed a good global model fit. Therefore, we concluded that scalar invariance holds across the UK and Germany.
These results imply that there is evidence of equal validity coefficients between the UK and Germany, and, therefore, the construct is supposed to have the same meaning across both countries. Moreover, the comparison of the latent means between the UK and Germany is allowed.
[1] Relatively small effect: |r| ≥ .10, typical (medium) effect: |r| ≥ .20, relatively large effect: |r| ≥ .30.
Acknowledgement
We would like to thank Melanie Partsch and Katharina Groskurth (both from GESIS – Leibniz Institute for the Social Science) for preparing the data. We would also like to thank Katharina Groskurth for supporting us with the measurement models and for her helpful comments at the corresponding sections of the documentation.
Doll, E. S., Nießen, D., Schmidt, I., Rammstedt, B., & Lechner, C. M.