Grit Scale for Perseverance and Passion for Long-Term Goals
Autor/in:
Breyer, B. & Danner, D.
In ZIS seit:
2015
Downloads
Aktionen
Nutzungsbedingungen
Zur Nutzung für andere Zwecke kontaktieren Sie die Autor*innen
Zusammenfassung:
Abstract:
The nine-item Grit Scale measures perseverance and passion for long-term goals. The items were originally developed by Duckworth, Peterson, Matthews, and Kelly (2007). The scale was used in the PIAAC field trial (OECD, 2013) and can predict the level of education and occupational status.
Sprache Dokumentation:
English
Sprache Items:
English (source), German
Anzahl der Items:
9
Reliabilität:
Raykov’s Composite Reliability = .70 to .77; Cronbach’s Alpha = .62 to .74
Validität:
evidence for criterion validity
Konstrukt:
grit, perseverance
Schlagwörter:
goal, consistency, interests, discipline
Item(s) in Bevölkerungsumfrage eingesetzt:
yes
URL Webseite:
http://www.oecd.org/site/piaac/
Skalenentwicklung:
Items
Table 1
Items of the Grit Scale (PIAAC field trial 2010)
|
No. |
Item |
|
Polarity |
|
1 |
I am a hard worker |
Ich bin jemand, der hart arbeitet |
+ |
|
2 |
I get enthusiastic about ideas for a short time but later lose interest |
Ich kann mich kurzfristig für Ideen begeistern, verliere aber dann das Interesse daran |
- |
|
3 |
I am self-disciplined |
Ich habe Selbstdisziplin |
+ |
|
4 |
I can cope with setbacks |
Ich komme mit Rückschlägen gut zurecht |
+ |
|
5 |
New projects sometimes distract me from previous ones |
In der Verfolgung meiner Ziele lasse ich mich manchmal von anderen Ideen ablenken |
- |
|
6 |
I am good at resisting temptation |
Ich kann Versuchungen gut widerstehen |
+ |
|
7 |
I finish whatever I begin |
Was ich begonnen habe, bringe ich auch zu Ende |
+ |
|
8 |
I have difficulty maintaining focus on projects or tasks that take more than a few months to complete |
Ich habe Schwierigkeiten, meine Konzentration auf Vorhaben oder Aufgaben aufrecht zu erhalten, deren Durchführung mehr als ein paar Monate in Anspruch nimmt |
- |
|
9 |
I have trouble concentrating |
Mir fällt es schwer, mich zu konzentrieren |
- |
Response specifications
All items are answered on a five-point scale ranging from 1 = “not at all/ überhaupt nicht” to 5 = “to a very high extent/ in sehr hohem Maße”.
Scoring
Negatively keyed items are reverse-scored (6 – raw score), and the composite scale score is computed as the mean of all items.
Application field
The scale can be used in a large variety of situations associated with accomplishment (e.g. work, school). The scale displays metric invariance across countries and can thus be applied in international assessments to investigate associations between grit and other variables across countries. The scale can be used in paper-pencil or computer-based format. Questions can be asked orally or written and in single as well as in group examinations.
The Grit Scale was developed by Duckworth, Peterson, Matthews, and Kelly (2007). They define grit as "perseverance and passion for long-term goals" (Duckworth et al., 2007, p. 1087). Persons with high grit work strenuously and motivated towards a goal or challenge over years. Because of their strong stamina and self-discipline, they do not get discouraged by stagnation or setbacks. Interests and effort remain consistent. Grit is related to self-control (ability to resist temptation and control impulses) and need for achievement (implicit persuit of moderately difficult goals, followed by immediate feedback). However, it differs from these concepts due to its long-term-intensity, awareness and consistency despite of missing feedback. According to Duckworth et al. (2007), grit is highly correlated with Big Five Conscientiousness, but has an incremental validity of beyond conscientiousness and IQ regarding success measures.
Item generation and selection
In 2007, Duckworth, Peterson, Matthews, and Kelly developed the first version of the Grit Scale. It included 27 items and was tested with a sample of n = 1,545 participants aged 25 and older with different education (M = 45 years; 73% women, 27% men; Duckworth et al., 2007). Items had been selected under consideration of independency from respondents' age and life domains. They should contain typical attitudes and behaviors of high-achieving individuals, including sustaining effort in case of setbacks and consistency of interests over time. Considering item correlations, reliability coefficients and redundancy, the scale was reduced to a final version with 12 items. For the PIAAC field trial 2010, another reduced version of the Grit Scale with 9 items was used.
Samples
The Grit Scale was administered in the PIAAC field trial 2010, in which 21 OECD countries participated: Austria (AT), Belgium (BE), Chile (CL), Cyprus (CY), Czech Republic (CZ), Denmark (DK), Estonia (EE), Finland (FI), France (FR), Germany (DE), Ireland (IE), Italy (IT), Japan (JP), Korea (KR), Netherlands (NL), Norway (NO), Poland (PL), Portugal (PT), Spain (ES), Sweden (SE), United Kingdom (UK).
A total of n = 7,102 respondents completed the scale. Portugal was excluded from the analyses due to small sample size (n = 11). The number of respondents who completed the grit items and provided information on the criterion variables (competence, education, occupational status, income) is shown in the Appendix in Table A1.
Item parameter
Means and standard deviations of the items are shown in Table 2.
Table 2
Means and standard deviations of the Grit Scale for the total sample (PIAAC 2010)
|
|
Item |
M |
SD |
|
1 |
I am a hard worker |
3.91 |
0.90 |
|
2 |
I get enthusiastic about ideas for a short time but later lose interest (-) |
3.60 |
1.08 |
|
3 |
I am self-disciplined |
3.80 |
0.96 |
|
4 |
I can cope with setbacks |
3.79 |
0.89 |
|
5 |
New projects sometimes distract me from previous ones (-) |
3.48 |
1.02 |
|
6 |
I am good at resisting temptation |
3.39 |
1.02 |
|
7 |
I finish whatever I begin |
4.01 |
0.87 |
|
8 |
I have difficulty maintaining focus on projects or tasks that take more than a few months to complete (-) |
3.81 |
1.09 |
|
9 |
I have trouble concentrating (-) |
4.06 |
.99 |
Note. Negatively keyed items (-) were recoded. 1 = “not at all” to 5 = “to a very high extent”, n = 7,091 (total).
Objectivity
Data from PIAAC 2010 were collected in a computer-based assessment (CBA) on a laptop under the supervision of an interviewer. Therefore, objectivity of application is ensured. A high objectivity of interpretation is achieved by using fixed categories and a norming sample (see descriptive statistics) for the scale.
Reliability
The reliability of a measure is defined as the proportion of true score differences relative to observed differences. The reliability of the manifest grit scores was estimated on the basis of a structural equation model (see Figure 1). We used the composite reliability estimation method suggested by Raykov (1997), where the reliability of a composite score is estimated on the basis of the factor loadings, the variance of the latent grit variable, the variance of the latent acquiescence variable, and the error variances of the residual measurement error variables. In addition, Cronbach’s alpha is reported. The estimates are shown in Table 3.
Composite reliability of grit score for each country
|
Country |
Composite Reliability |
Cronbach’s alpha |
|
Austria |
.74 |
.72 |
|
Belgium |
.75 |
.71 |
|
Chile |
.71 |
.69 |
|
Cyprus |
.70 |
.62 |
|
Czech Republic |
.74 |
.70 |
|
Denmark |
.73 |
.71 |
|
Estonia |
.76 |
.73 |
|
Finland |
.72 |
.68 |
|
France |
.74 |
.69 |
|
Germany |
.74 |
.70 |
|
Ireland |
.74 |
.73 |
|
Italy |
.74 |
.68 |
|
Japan |
.73 |
.71 |
|
Korea |
.75 |
.73 |
|
Netherlands |
.73 |
.69 |
|
Norway |
.71 |
.68 |
|
Poland |
.73 |
.66 |
|
Spain |
.77 |
.74 |
|
Sweden |
.72 |
.70 |
|
United Kingdom |
.77 |
.74 |
|
Mean Reliability |
.74 |
.70 |
Note. Composite reliability estimated as suggested by Raykov (1997).
As can be seen from Table 3, the composite reliability of the manifest grit score ranged between .70 (Cyprus) and .77 (Spain, United Kingdom), with an average of .74. This suggests that 74% of the manifest Grit variance reflects true score differences. The nine-item scale allows therefore a moderately reliable measurement of grit.
Validity
The criterion validity of the manifest grit score was evaluated on the basis of the correlation with competence (composite of literacy, numeracy, and problem solving), level of education, employment, and income (logarithmized). We expected all variables to correlate positively with the grit score because motivation and perseverance for long-term goals facilitates the acquisition of competence, education, a job, and a higher salary. The correlations are shown in Table 4 below.
Table 4
Correlation between grit score and criterion variables by country
|
Country |
Competence |
Level of education (binary)1 |
Employment (binary)1 |
Income (logarithmized)1 |
||||
|
Austria |
.06 |
|
.20 |
*** |
.07 |
|
.11 |
|
|
Belgium |
-.01 |
|
-.04 |
|
.05 |
|
-.01 |
|
|
Chile |
-.03 |
|
.14 |
|
.10 |
|
.12 |
|
|
Cyprus |
.17 |
** |
.15 |
* |
.21 |
*** |
.19 |
* |
|
Czech Republic |
-.05 |
|
.04 |
|
.17 |
** |
.01 |
|
|
Denmark |
.01 |
|
.13 |
* |
.11 |
|
.01 |
|
|
Estonia |
.05 |
|
.19 |
** |
.10 |
|
-.02 |
|
|
Finland |
-.02 |
|
.05 |
|
.05 |
|
.06 |
|
|
France |
.08 |
|
.09 |
|
.13 |
** |
.05 |
|
|
Germany |
-.02 |
|
.14 |
** |
.14 |
* |
.12 |
|
|
Ireland |
.06 |
|
.17 |
* |
.08 |
|
.06 |
|
|
Italy |
.08 |
|
.13 |
* |
.13 |
* |
.12 |
|
|
Japan |
-.03 |
|
-.03 |
|
.07 |
|
.10 |
|
|
Korea |
-.04 |
|
-.06 |
|
.10 |
|
-.01 |
|
|
Netherlands |
-.13 |
* |
.01 |
|
.15 |
** |
.09 |
|
|
Norway |
.01 |
|
.01 |
|
.10 |
|
.02 |
|
|
Poland |
-.02 |
|
.05 |
|
.17 |
** |
-.01 |
|
|
Spain |
-.03 |
|
.05 |
|
.03 |
|
.07 |
|
|
Sweden |
-.03 |
|
.16 |
|
.16 |
* |
.04 |
|
|
United Kingdom |
.19 |
*** |
|
|
.12 |
* |
-.08 |
|
|
Average correlation2 |
.02 |
|
.08 |
*** |
.11 |
*** |
.05 |
** |
|
Correlation across all countries |
.01 |
|
.05 |
*** |
.09 |
*** |
-.10 |
*** |
Note. 1 Only respondents who completed their education. 2 Correlations were Fisher-Z-transformed, averaged, and then back-transformed. * p <.05. ** p <.01. *** p <.001.
As can be seen from Table 4, there was no systematic relation between grit and ETS competence score. On average, the correlation was r = .02. In most countries, correlations were only small and non-significant. There were positive correlations in the United Kingdom (r = .19) and Cyprus (r = .17), but there was a negative correlation in the Netherlands (r = -.13). On the one hand, this suggests that grit is not a precondition for acquiring competencies. On the other hand, it suggests that grit describes an aspect of personality that is incremental to cognitive ability. Grit and level of education were positively correlated in most countries. On average, the correlation was r = .08. The strongest associations were found in Austria (r = .20), Estonia (r = .19), and Ireland (r = .17). The weakest associations were found in the Netherlands (r = .01) and Norway (r = .01). Occupational status was positively associated with grit in all countries. On average, the correlation was r = .11; the strongest association was found in Cyprus (r = .21), in the Czech Republic (r = .17), and in Sweden (r =.16). There was no significant correlation between grit and income in most countries. On average, the correlation was r = .05. The only significant correlation was found in Cyprus (r = .19), and the correlation across all countries was negative. This different pattern of results within and between countries may be due to different income levels between countries. In sum, the present results support the criterion validity of the scale score. As expected, in most countries there were positive associations between grit and level of education and between grit and employment. However, there was no consistent correlation with competence or income.
Descriptive statistics
Means and standard deviations for the Grit Scale are presented in Table 5.
Reference values for the Grit Scale
|
|
M |
SD |
|
Austria |
3.86 |
.53 |
|
Belgium |
3.97 |
.49 |
|
Chile |
3.96 |
.58 |
|
Cyprus |
3.87 |
.51 |
|
Czech Republic |
3.67 |
.54 |
|
Denmark |
3.73 |
.50 |
|
Estonia |
3.62 |
.46 |
|
Finland |
3.75 |
.52 |
|
France |
3.77 |
.58 |
|
Germany |
3.81 |
.52 |
|
Ireland |
3.70 |
.55 |
|
Italy |
3.79 |
.50 |
|
Japan |
3.26 |
.52 |
|
Korea |
3.68 |
.59 |
|
Netherlands |
3.82 |
.55 |
|
Norway |
3.72 |
.42 |
|
Poland |
3.81 |
.52 |
|
Portugal |
3.80 |
.60 |
|
Spain |
3.85 |
.64 |
|
Sweden |
3.71 |
.51 |
|
United Kingdom |
3.73 |
.58 |
|
Total |
3.75 |
.55 |
Note. Scale ranging from 1 = “not at all” to 5 = “to a very high extent”. Negatively keyed items were recoded. n = 7,102.
Further quality criteria
The Grit Scale can be seen as economic because the items can be completed quickly. In the PIAAC field Trial, completing the Grit Scale took 108 s on average. Testfairness or measurement invariance is given if certain groups of participants are not systematically disadvantaged because of their group membership. In order to evaluate the measurement invariance across countries and the reliability of the Grit Scale, we estimated a number of different measurement models. Configural invariance indicates that the factor structure of a construct is invariant across countries, metric invariance indicates that the meanings of the items are invariant across countries, and scalar invariance indicates that the meanings and the item intercepts are invariant across countries. First, we tested configural invariance by estimating a unidimensional measurement model with one latent grit variable, free factor loadings, and residual measurement error variables for each item. All parameters were allowed to differ between countries. Second, we added a latent acquiescence response style variable to the model because the scale consisted of positively keyed and reverse-keyed items (cf. Billiet & McClendon, 2000; Danner, Aichholzer, & Rammstedt, 2015). The latent acquiescence variable was specified to load positively on the positively keyed and the reverse-keyed items (all λ = 1) and to be independent of the grit variable. Hence, the latent acquiescence variable models the tendency of respondents to agree with items regardless of their content. Third, we tested metric invariance by constraining all factor loadings (λ) to be equal across countries. Fourth, we tested scalar measurement invariance by additionally constraining all item intercepts (δ) to be equal across countries (cf. Chen, 2007; Vandenberg & Lance, 2000). The model structure is shown in Figure 1.
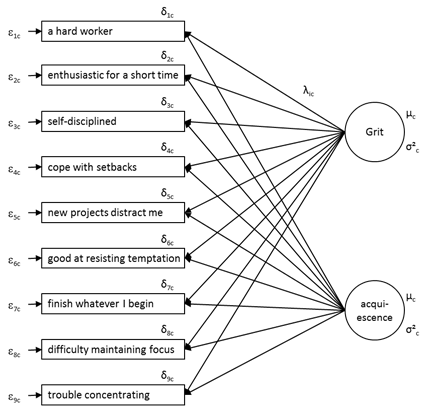
Figure 1. Measurement model with latent grit variable, latent acquiescence variable, factor loadings (λ), latent means (μ), variances (σ²), and intercepts (δ) for c countries, factor loadings of the latent grit variable were freely estimated; factor loadings of the latent acquiescence variable were all fixed to 1.
The fit of the measurement models was evaluated on the basis of the root mean square error of approximation (RMSEA), the comparative fit index (CFI), and the standardized root mean square residual (SRMR). In general, an RMSEA ≤ .060 suggests an overall acceptable model fit (Hu & Bentler, 1999); a difference of ΔRMSEA ≤ .015, a ΔCFI ≤ .010, and a ΔSRMR ≤ .030 between the configural and the metric invariance model suggests metric invariance; and a difference of ΔRMSEA ≤ .015, a ΔCFI ≤ .010, and a ΔSRMR ≤ .010 between the metric and the scalar invariance model suggests scalar invariance (Chen, 2007).
Table 6
Measurement models for the Grit Scale
|
Measurement Model |
Description |
RMSEA |
CFI |
SRMR |
χ² |
df |
|
Configural Invariance Model (without acquiescence) |
Same factor structure for all countries, no acquiescence |
.101 |
.787 |
.066 |
2,489.06 |
540 |
|
Configural Invariance Model (with acquiescence) |
Same factor structure for all countries, acquiescence |
.068 |
.906 |
.051 |
1,378.64 |
520 |
|
Metric Invariance Model (with acquiescence) |
Same factor loadings for all countries, acquiescence |
.065 |
.889 |
.076 |
1,689.37 |
672 |
|
Scalar Invariance Model (with acquiescence) |
Same factor loadings and same intercepts for all countries, acquiescence |
.098 |
.702 |
.107 |
3,536.96 |
805 |
Note. n = 7,091.
As can be seen from Table 3, none of the tested models fit the data perfectly but the metric invariance model (with a latent acquiescence variable) fits the data best. This suggests that the structure of the grit construct is the same in all countries and that the construct has equivalent meanings across countries. Hence, country differences in correlations between grit and other variables can be interpreted meaningfully. However, scalar invariance could not be accepted because the item intercepts differed between countries, which means that respondents’ answers were influenced not only by their level of grit but also by additional, country-specific factors. Differences in the means of the manifest grit variable should therefore be interpreted with caution. Different means of the manifest grit score can indicate either construct differences or differences in item intercepts. In addition, the latent acquiescence variable suggests that the manifest items are biased by acquiescent responding, which biases the factor structure of the Grit Scale. However, the composite scale score can be considered unaffected by acquiescence because the scale consists of five positively keyed and four negatively keyed items. We also investigated whether the lack of scalar invariance could be explained by specific items or specific countries. Table A2 of the Appendix shows the intercepts of the nine grit items per country. No item or country deviated systematically. This suggests that measurement invariance cannot be improved by revising (or excluding) a single item or the scale of a specific country.
Breyer, B. & Danner, D.