Authoritarianism Short Scale (KSA-3)
Autor/in:
Nießen, D., Schmidt, I., Beierlein, C., & Lechner, C. M.
In ZIS seit:
2019
Downloads
Aktionen
Nutzungsbedingungen
Zur Nutzung für andere Zwecke kontaktieren Sie die Autor*innen
Zusammenfassung:
Abstract:
The Authoritarianism Short Scale - the English-language adaptation of the Kurzskala Autoritarismus (KSA-3) - measures the psychological disposition of authoritarianism and its three subdimensions aggression, submissiveness, and conventionalism with a total of 9 items (completion time < 1 min). The items of the German-language source version were translated into English using the TRAPD approach. Our empirical validation based on a heterogeneous quota sample in the UK showed that all the reliability and validity coefficients of the English-language adaptation are satisfactory and comparable to those of the German-language source version. Moreover, the results of measurement invariance testing suggested that partial scalar measurement invariance of the scale holds when comparing the UK and Germany, thus, implying the comparability of latent means across the two countries. As short scale, KSA-3 lends itself to the assessment of authoritarianism particularly in survey contexts in which assessment time or questionnaire space are limited. It is applicable in a variety of research disciplines, including psychology, sociology, and economics.
Sprache Dokumentation:
English
Sprache Items:
English, German (source)
Anzahl der Items:
9
Erhebungsmodus:
CASI
Bearbeitungszeit:
< 1 min
Reliabilität:
retest ≥ .58; McDonald's omega ≥ .79
Validität:
evidence for factorial, construct, and criterion validity
Konstrukt:
authoritarianism (aggression, submissiveness, conventionalism)
Schlagwörter:
attitude, authority, aggression, obedience, conventionalism
Item(s) in Bevölkerungsumfrage eingesetzt:
yes
Skalenentwicklung:
Instruction
How would you rate the following statements?
Items
Table 1
Items of the English-Language Adaptation of the Authoritarianism Short Scale (KSA-3)
|
No. |
Item |
Subscale |
|
1 |
We should take strong action against misfits and slackers in society. |
Authoritarian aggression |
|
2 |
Troublemakers should be made to feel that they are not welcome in society. |
Authoritarian aggression |
|
3 |
Rules in society should be enforced without pity. |
Authoritarian aggression |
|
4 |
We need strong leaders so that we can live safely in society. |
Authoritarian aggression |
|
5 |
People should leave important decisions in society to their leaders. |
Authoritarian submissiveness |
|
6 |
We should be grateful for leaders telling us exactly what to do. |
Authoritarian submissiveness |
|
7 |
Traditions should definitely be carried on and kept alive. |
Conventionalism |
|
8 |
Well-established behavior should not be questioned. |
Conventionalism |
|
9 |
It's always best to do things in the usual way. |
Conventionalism |
Note. Note that in the original scale developed by Beierlein et al. (2015) item 4 belonged to the subdimension authoritarian submissiveness.
Response specifications
Items are answered using a fully labeled 5-point rating scale.
- do not agree at all (1)
- hardly agree (2)
- somewhat agree (3)
- mostly agree (4)
- completely agree (5)
Scoring
The KSA-3 (Kurzskala Autoritarismus [Authoritarianism Short Scale]) consists of nine items covering three subscales of authoritarianism: authoritarian aggression, authoritarian submissiveness, and conventionalism. The English adaptations of these items are displayed in Table 1 (for the original German items, see Beierlein, Asbrock, Kauff, & Schmidt, 2015). As in the German source instrument, all items are positively worded in relation to the underlying construct. The scale score of authoritarianism can be computed separately for each subscale. For this purpose, the unweighted mean score of the two to four items of each subscale is computed. In addition, the unweighted mean score of these three subscale scores can be computed to obtain an authoritarianism scale total score. We suggest that individual answers should be aggregated to the scale level only if there are no missing values on any of the nine items. If there are missing values, we recommend using for example multiple imputation (e.g., Baraldi & Enders, 2013) but only for research purposes, not for individual diagnostics.
Application field
The Authoritarianism Short Scale measures authoritarianism in an economic and time-efficient way. As a short scale with a completion time of around < 1 min (estimated value), the KSA-3 is applicable in a variety of research areas. It is particularly well suited for research settings in which there are severe time limitations or constraints to questionnaire length. The KSA-3 was originally developed in German language (see Beierlein et al., 2015) and validated in German adults; it was adapted in the present research to the English language and validated in the United Kingdom, irrespective of age, gender, and social class. The scale is partially scalar invariant across the United Kingdom and Germany and can thus be applied in international assessments comparing correlations across the two countries. The KSA-3 is typically self-administrated, such as via paper-and-pencil or online questionnaire. However, provided slight adaptations to the instructions, an oral administration in a personal interview or telephone interview is also conceivable.
The construct authoritarianism denotes a psychological disposition characterized by (extreme) conservatism and conventionalism, submission to authority, and negative attitudes as well as aggression towards individuals and groups that are perceived as deviant. In the current research, authoritarianism is understood as a stable ideological attitude (e.g., Duckitt & Bizumic, 2013; Duckitt, Bizumic, Krauss, & Heled, 2010). Authoritarianism was first introduced in the 1950s by Theodor W. Adorno and colleagues as a personality trait to explain the emergence of fascism, nationalism, and antisemitism (e.g., Adorno, Frenkel-Brunswik, Levinson, & Sanford, 1950). Since the 1950s, psychological, sociological and political research has extended the concept authoritarianism continually in an international context (e.g., Duckitt et al., 2010). Starting in the 1980s, Altemeyer conceptually developed the construct from a personality trait to a system of social attitudes that is formed in adolescence (see Altemeyer, 1996). According to Altemeyer (1981, 1996), three subdimensions are sufficient to describe authoritarianism: authoritarian aggression, authoritarian submissiveness, and conventionalism. Authoritarian aggression refers to a general aggressiveness, which is directed against persons or groups of persons (outgroups) that are perceived to be sanctioned by established authorities. Authoritarian submissiveness refers to the submission to established authorities in the society you live in. Conventionalism refers to the adherence to social conventions that are perceived to be endorsed by society (established authorities).
Several studies could demonstrate that authoritarianism is one of the strongest predictors of generalized prejudice (e.g., Ekehammar, Akrami, Gylje, & Zakrisson, 2004; McFarland, 2010; Sibley & Duckitt, 2008) and predicts discrimination and intergroup conflict (e.g., Cohrs & Ibler, 2009; McFarland, 2010). Recent research topics in international authoritarianism research are, for example, on the relationship between authoritarianism and prejudice taking into account objective indicators such as crime in residential areas and the number of migrants (Sibley et al., 2013) or the effect of authoritarianism on the perception of threat (e.g., Cohrs & Ibler, 2009; Kauff, Asbrock, Thörner, & Wagner, 2013; Thomsen, Green, & Sidanius, 2008).
Despite Altemeyer's theoretical assumption that authoritarianism is multidimensional, it has long been empirically treated as a unidimensional construct. In the course of research, however, there is increasing evidence that the concentration on the superordinate construct authoritarianism can overlook peculiarities of subdimensions (e.g., Duckitt & Bizumik, 2013; Duckitt et al., 2010). The multidimensional structure of authoritarianism is theoretically and empirically justifiable. The subdimension conventionalism, for example, hardly shows any connections to prejudices (e.g., Duckitt & Bizumik, 2013; Feldman, 2003). Moreover, negative effects from authoritarian predisposition to diversity beliefs were mediated by authoritarian aggression but not by authoritarian submissiveness or conventionalism (Asbrock & Kauff, 2015). In contrast to the conceptualization of authoritarianism as a multidimensional construct, the most often used measurement instrument in authoritarianism research is the Right-Wing Authoritarianism scale (RWA; Altemeyer, 1998), which measures authoritarianism as a unidimensional construct. To resolve this critical issue, several other scales that assess the three subdimensions of authoritarianism were developed such as the German-language Balanced Short Scale of Authoritarian Attitudes (Balancierte Kurzskala autoritärer Einstellungen; B-RWA-6; Aichholzer & Zeglovits, 2015) or the English-language Very Short Authoritarianism scale (VSA; Bizumic & Duckit, 2018). However, a point of criticism that nearly applies to all scales based on Altemeyer's conceptualization of authoritarianism is that not only exclusively authoritarianism is captured but also conservative attitudes or prejudices, that is, only right-wing orientations were considered (Stellmacher & Petzel, 2005). This also applies to the recently developed VSA.
In order to meet the criticism, Beierlein and colleagues (2015) developed and evaluated the German-language KSA-3 as an economic, valid, and reliable instrument that allows to assess the three subdimensions of authoritarianism in the sense of Altemeyer (1981, 1996) as well as a superordinate construct. An empirical investigation of the appropriateness of its English-language adaption was hitherto lacking.
Item generation and selection
To develop the German-language source version of the KSA-3, Beierlein et al. (2015) drew on items from existing authoritarianism scales, such as two German-language adaptations of the RWA scale (Petzel, Wagner, Nicolai, & van Dick, 1997; RWA3D; Funke, 2005), a German-language adaptation of the Social Dominance Orientation scale (SDO; Cohrs, Moschner, Maes, & Kielmann, 2005), and a German-language Authoritarian Short Scale (Autoritarismus-Kurzskala; Schmidt, Stephan, & Hermann, 2005). As these items were evaluated as inappropriate (e.g., because they contained loanwords, double stimuli within one item, or complex sentence constructions), they were revised to make them more optimal. Additionally new items were generated. The revised and the new items were then tested using item analysis and exploratory factor analysis (EFA). In the further construction process, the authors discarded some items with for instance low or high difficulty, low variance, and low discrimination (for more detailed information, see Beierlein et al., 2015). The German-language KSA-3 was thoroughly validated based on a comprehensive sample representative of the adult population in Germany in terms of age, gender, and educational attainment.
As researchers may be interested in comparing the level of authoritarianism between different societies, there is a need for a cross-culturally valid measure. To enhance the usability of the KSA-3, and to enable social surveys to use the KSA-3 in an English-language context, the scale was adapted to the English language and validated for the UK population. First, the nine items of the KSA-3 were adapted to English by translating the items following the TRAPD approach (Translation, Review, Adjudication, Pretesting, and Documentation; Harkness, 2003), whereby two professional translators (English native speakers) translated the items independently of each other into British English and American English, respectively. Second, an adjudication meeting was held where psychological experts, the two translators, and an expert in questionnaire translation reviewed the various translation proposals and developed the final translation.
The source instrument by Beierlein et al. (2015) was developed in and validated for the German language. The aim of the present study was to validate the English-language adaptation of the KSA-3 and to directly compare its psychometric properties with those of the German-language source version.
Samples
To investigate the psychometric properties of the English-language adaptation of the KSA-3, and their comparability with those of the German-language source instrument, we assessed both versions in a web-based survey (using computer-assisted self-administered interviewing [CASI]) conducted in the UK and Germany (DE) by the online access panel provider respondi AG. Fielding took place in January 2018. For both the UK and Germany, quota samples were drawn that represented the heterogeneity of the adult population with regard to age, gender, and educational attainment. Only native speakers of the respective languages were recruited. We explained our research goal (investigation of the quality of several questionnaires) to the participants. Respondents were financially rewarded for their participation. In both states, a subsample was reassessed after approximately 3 to 4 weeks (MdnUK = 28 days; MdnDE = 20 days).
Only respondents who completed the full questionnaire - that is, who did not abort the survey prematurely - were included in our analyses. To handle missing values on single items, we used full information maximum likelihood estimation (FIML) in our analyses. This yielded gross samples of NUK = 508 and NDE = 513. In the next step, invalid cases were excluded based on (a) ipsatized variance - that is, the within-person variance across items (Kemper & Menold, 2014) - if the person fell within the lower 5% of the sample distribution of ipsatized variance; (b) the Mahalanobis distance of a person's response vector from the average sample response vector (Meade & Craig, 2012) if he or she fell within the upper 2.5% of the sample distribution of the Mahalanobis distance; and (c) response time if the person took, on average, less than 1 s to respond to an item. Our intention in choosing relatively liberal cut-off values was to avoid accidentally excluding valid cases and thereby creating a systematic bias in our data. The outlined approach resulted in total exclusion of 7.9% of cases in the UK subsample and 7.6% of cases in the DE subsample, yielding net sample sizes of NUK = 468 (retest: NUK = 111) and NDE = 474 (retest: NDE = 117). Table 2 depicts in detail the sample characteristics and their distribution.
Table 2
Sample Characteristic Features
|
|
United Kingdom |
Germany |
|
N |
468 |
474 |
|
Mean age in years (SD) [Range] |
45.2 (14.5) [18-69] |
44.0 (14.4) [18-69] |
|
Proportion of women (%) |
52.6 |
50.0 |
|
Educational level (%) |
|
|
|
Low: never went to school, skills for life/1-4 GCSEs A*-C or equivalent |
34.8 |
33.5 |
|
Intermediate: 5 or more GCSEs A*-C/vocational GCSE/GNVQ intermediate or equivalent |
32.1 |
33.8 |
|
High: 2 or more A-levels or equivalent |
33.1 |
32.7 |
Note. The equivalent German educational levels were as follows (from low to high): ohne Bildungsabschluss/Hauptschule [no educational qualification; lower secondary leaving certificate]; mittlerer Schulabschluss [intermediate school leaving certificate]; (Fach-)Hochschulreife [higher education entrance qualification].
Material
The online survey was conducted in German for the German sample and in English for the UK sample. It comprised the respective language versions of the KSA-3. To validate the KSA-3 against (a) the Big Five dimensions of personality, (b) political preferences, (c) political efficacy, and (d) socially desirable responding, respectively, the following short scale measures were also administered as part of the survey:
(a) the extra-short form of the Big Five Inventory-2 (BFI-2-XS; English version: Soto & John, 2017; German version: Rammstedt, Danner, Soto, & John, 2020)
(b) the political Left-Right Self-Placement scale (English and German version: Breyer, 2015)
(c) the Political Efficacy Kurzskala [Political Efficacy Short Scale] (PEKS; English version: Groskurth, Nießen, Rammstedt, & Lechner, 2019; German version: Beierlein, Kemper, Kovaleva, & Rammstedt, 2014)
(d) the Social Desirability-Gamma Short Scale (KSE-G; English version: Nießen, Partsch, Kemper, & Rammstedt, 2019; German version: Kemper, Beierlein, Bensch, Kovaleva, & Rammstedt, 2014)
In addition, a set of sociodemographic variables (gender, age, highest level of education, income, and employment status) was measured.
Item analyses
We investigated the factorial structure of the KSA-3 in the UK and Germany in two separate confirmatory factor analyses (CFA) using R (package lavaan) and a hierarchical multidimensional measurement model developed for Germany by Beierlein et al. (2015) with three latent factors of first order capturing the three subdimensions aggression, submissiveness, and conventionalism and with one latent factor of second order capturing authoritarianism. Because model fit indices proved to be poor,[1] we ran separate exploratory factor analyses (EFA) for the two countries, comparing one- to three-factor solutions using Mplus with oblique oblimin rotation. The fit indices and factor loadings implicated a three-factor solution, but item 4 (originally belonging to subdimension submissiveness) had a higher factor loading on the factor that represented subdimension aggression. This deviation can also be justified from a content point of view. Item 4 implies rigorous enforcement of leaders, a behaviour that reflects (active) aggression more than it reflects (passive) submissiveness. Therefore, we ran again two separate confirmatory factor analyses (CFA) using R and the abovementioned hierarchical multidimensional measurement model with the only difference that subdimension aggression now comprised four items and subdimension submissiveness only two. As the fit indices for both countries proved to be acceptable[2], we subsequently conducted multiple-group confirmatory factor analyses (MG-CFA). In both the UK and Germany, factor loadings and item intercepts were freely estimated, whereas the variance of the latent factors was set to 1. We used a maximum likelihood with robust standard errors (MLR) estimation. The model is plotted in Figure 1; its fit indices suggest an acceptable model fit (Hu & Bentler, 1999; Schermelleh-Engel, Moosbrugger, & Müller, 2003; Schweizer, 2010). The fit indices refer to the commonly used MLR-scaled root mean square error of approximation (RMSEA) and comparative fit index (CFI), which - strictly speaking - apply only to populations: χ²(48) = 173.175 (UK: χ² = 81.826; DE: χ² = 91.350), p < .001, CFI = .959, RMSEA = .074, SRMR [standardized root mean square residual] = .042[3]. The size of the items' factor loadings also confirms the hierarchical multidimensional measurement mode (see Figure 1) and gives a first indication of the factorial validity of the scale. The syntax for all analysis can be found in the Appendix.
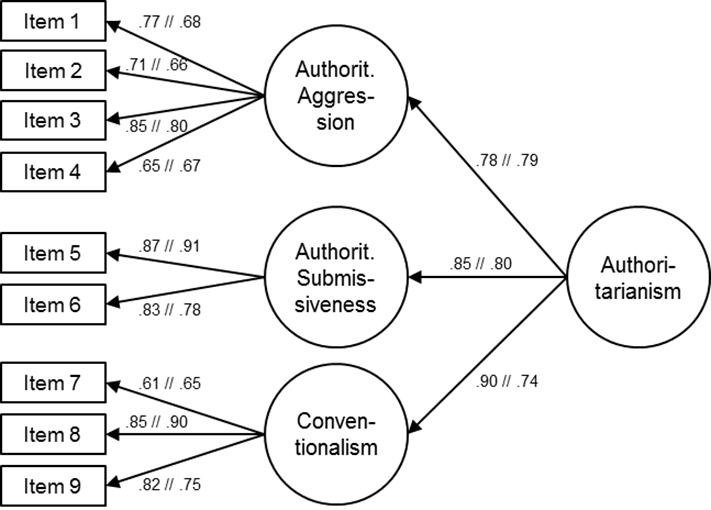
Figure 1. Hierarchical multidimensional measurement model of the KSA-3 with standardized coefficients. The coefficients of the German sample are presented after the double slash. Item error terms are omitted for clarity. NUK = 468; NDE = 474.
Item parameters
Table 3 shows the means, standard deviations, skewness, and kurtosis for the nine items as well as for the three subscales and the factor of second order and Table 4 shows the inter-item correlations, both separately for the English and German samples. The inter-subscale correlations are as follows: UK - rAggression/Submissiveness = .55, rAggression/Conventionalism = .59, rSubmissiveness/Conventionalism = .63; DE - rAggression/Submissiveness = .51, rAggression/Conventionalism = .49, rSubmissiveness/Conventionalism = .51 (for all correlations: p < .001).
Table 3
Descriptive Statistics for the KSA-3 Items, Subscales, and Higher Factor
|
|
M |
SD |
Skewness |
Kurtosis |
||||
|
Item |
UK |
DE |
UK |
DE |
UK |
DE |
UK |
DE |
|
Authoritarianism |
2.86 |
2.93 |
0.82 |
0.77 |
0.19 |
−0.01 |
−0.14 |
−0.10 |
|
Aggression |
3.24 |
3.29 |
0.95 |
0.89 |
−0.04 |
−0.18 |
−0.50 |
−0.38 |
|
1 |
3.07 |
2.94 |
1.16 |
1.15 |
0.00 |
0.10 |
−0.78 |
−0.72 |
|
2 |
3.26 |
3.61 |
1.22 |
1.12 |
−0.14 |
−0.49 |
−0.90 |
−0.45 |
|
3 |
2.90 |
3.11 |
1.21 |
1.11 |
0.03 |
−0.14 |
−0.91 |
−0.61 |
|
4 |
2.79 |
2.85 |
0.89 |
0.91 |
0.22 |
−0.05 |
−0.11 |
−0.30 |
|
Submissiveness |
2.31 |
2.53 |
1.03 |
0.99 |
0.62 |
0.24 |
−0.10 |
−0.49 |
|
5 |
2.55 |
2.63 |
1.13 |
1.08 |
0.33 |
0.21 |
−0.56 |
−0.54 |
|
6 |
2.08 |
2.43 |
1.08 |
1.06 |
0.92 |
0.36 |
0.30 |
−0.49 |
|
Conventionalism |
3.02 |
2.98 |
0.93 |
0.93 |
−0.04 |
−0.12 |
−0.39 |
−0.31 |
|
7 |
3.53 |
3.44 |
1.04 |
1.14 |
−0.31 |
−0.41 |
−0.35 |
−0.54 |
|
8 |
2.78 |
2.86 |
1.15 |
1.11 |
0.10 |
0.10 |
−0.73 |
−0.61 |
|
9 |
2.76 |
2.65 |
1.09 |
1.06 |
0.11 |
0.19 |
−0.59 |
−0.50 |
Note. UK = United Kingdom (N = 468); DE = Germany (N = 474).
Table 4
Inter-Item Correlations for the KSA-3
|
|
Aggression |
Submissiveness |
Conventionalism |
||||||
|
Item |
1 |
2 |
3 |
4 |
5 |
6 |
7 |
8 |
9 |
|
UK |
|
|
|
|
|
|
|
|
|
|
Aggression |
|
|
|
|
|
|
|
|
|
|
1 |
|
.59 |
.64 |
.53 |
.41 |
.36 |
.31 |
.45 |
.36 |
|
2 |
.59 |
|
.60 |
.42 |
.40 |
.36 |
.33 |
.42 |
.37 |
|
3 |
.64 |
.60 |
|
.54 |
.55 |
.45 |
.37 |
.54 |
.48 |
|
4 |
.53 |
.42 |
.54 |
|
.45 |
.31 |
.44 |
.45 |
.35 |
|
Submissiveness |
|
|
|
|
|
|
|
|
|
|
5 |
.41 |
.40 |
.55 |
.45 |
|
.72 |
.40 |
.54 |
.55 |
|
6 |
.36 |
.36 |
.45 |
.31 |
.72 |
|
.36 |
.56 |
.57 |
|
Conventionalism |
|
|
|
|
|
|
|
|
|
|
7 |
.31 |
.33 |
.37 |
.44 |
.40 |
.36 |
|
.52 |
.51 |
|
8 |
.45 |
.42 |
.54 |
.45 |
.54 |
.56 |
.52 |
|
.70 |
|
9 |
.36 |
.37 |
.48 |
.35 |
.55 |
.57 |
.51 |
.70 |
|
|
DE |
|
|
|
|
|
|
|
|
|
|
Aggression |
|
|
|
|
|
|
|
|
|
|
1 |
|
.53 |
.52 |
.41 |
.39 |
.34 |
.31 |
.33 |
.28 |
|
2 |
.53 |
|
.55 |
.42 |
.26 |
.21 |
.25 |
.27 |
.17 |
|
3 |
.52 |
.55 |
|
.52 |
.47 |
.37 |
.37 |
.43 |
.33 |
|
4 |
.41 |
.42 |
.52 |
|
.50 |
.39 |
.40 |
.40 |
.32 |
|
Submissiveness |
|
|
|
|
|
|
|
|
|
|
5 |
.39 |
.26 |
.47 |
.50 |
|
.71 |
.33 |
.45 |
.46 |
|
6 |
.34 |
.21 |
.37 |
.39 |
.71 |
|
.32 |
.40 |
.45 |
|
Conventionalism |
|
|
|
|
|
|
|
|
|
|
7 |
.31 |
.25 |
.37 |
.40 |
.33 |
.32 |
|
.59 |
.43 |
|
8 |
.33 |
.27 |
.43 |
.40 |
.45 |
.40 |
.59 |
|
.68 |
|
9 |
.28 |
.17 |
.33 |
.32 |
.46 |
.45 |
.43 |
.68 |
|
Note. UK = United Kingdom (N = 468); DE = Germany (N = 474).
All correlations are significant on the < .001 level.
[1] UK - χ²(24) = 150.319, p < .001, CFI = .924, RMSEA = .106, SRMR = .063; DE - χ²(24) = 131.104, p < .001, CFI = .923, RMSEA = .097, SRMR = .062.
[2] UK - χ²(24) = 80.139, p < .001, CFI = .966, RMSEA = .071, SRMR = .036; DE - χ²(24) = 93.314, p < .001, CFI = .950, RMSEA = .078, SRMR = .048.
[3] Taking the sample size into account prevents biased fit indices and yields so-called robust CFI and robust RMSEA values in R/lavaan (Brosseau-Liard, Savalei, & Li, 2012; Brosseau-Liard & Savalei, 2014): robust CFI = .962, robust RMSEA = .081.
5 Quality criteria
To validate the English-language adaptation of the KSA-3 and to investigate its comparability with the German-language source version, we analyzed psychometric criteria - more precisely, objectivity, reliability, and validity - in both language versions. Moreover, we assessed test fairness across both countries via measurement invariance tests.
Objectivity
The standardized questionnaire format and written instructions, the fixed scoring rules and labeled categories, and the reference ranges ensured the objectivity of the application, evaluation, and interpretation of the KSA-3.
Reliability
As estimates for the reliability of the KSA-3, we computed McDonald's omega (McDonald, 1999; Raykov, 1997) using R (package semTools) and the test-retest stability both for the KSA-3 and the three subscales. The rationale for using this measure was that McDonald's omega is a more appropriate measure than Cronbach's alpha (Cronbach, 1951) in the current context when specifying a tau-congeneric model. Measuring internal consistency with Cronbach's alpha is limited in the case of short scales, where items are selected to reflect the bandwidth of the underlying dimension (i.e., its heterogeneity but not its homogeneity).
As Table 5 shows, the reliability estimates for the KSA-3 ranged between .58 and .92 (UK) and between .54 and .90 (DE), which can be deemed sufficient for research purposes (Aiken & Groth-Marnat, 2006; Kemper, Trapp, Kathmann, Samuel, & Ziegler, 2019). Unlike what often occurs with (ultra-)short scales, test-retest reliability (UK: ≥ .58; DE: ≥ .54) was lower than internal consistency (UK: ≥ .79; DE: ≥ .73). In detail, the KSA-3 proved to be slightly more reliable in the UK than in Germany (especially for the subdimension aggression).
Table 5
Reliability Estimates for the KSA-3
|
|
UK |
DE |
UK |
DE |
||
|
(Sub-)Scale |
ω |
ω |
rtt |
CI95% |
rtt |
CI95% |
|
Authoritarianism |
.92a (.79h) |
.90a (.73h) |
.79 |
[.61, .85] |
.72 |
[.62, .79] |
|
Aggression |
.84 |
.79 |
.78 |
[.69, .84] |
.62 |
[.49, .72] |
|
Submissiveness |
.84 |
.83 |
.58 |
[.45, .69] |
.54 |
[.40, .66] |
|
Conventionalism |
.82 |
.81 |
.74 |
[.64, .81] |
.72 |
[.62, .80] |
Note. UK = United Kingdom (N = 468; retest: N = 111); DE = Germany (N = 474; retest: N = 117). The time interval between test and retest ranged between 3 to 4 weeks (MdnUK = 28 days; MdnDE = 20 days). The a indicates omega values of the total scale across all items (Raykov & Marcoulides, 2012), which is a proxy to the reliability of the KSA-3 score. The h indicates hierarchical omega values (Brunner, Nagy, & Wilhelm, 2012).
Validity
Besides content-related validity, which was ensured by Beierlein et al. (2015) during the original scale development process, we investigated three types of validity: factorial validity, construct validity, and criterion validity. The dimensionality of the construct and the size of the items' factor loadings (see Figure 1) indicate the factorial validity of the scale.
Convergent and discriminant construct validity and concurrent criterion validity were computed based on manifest correlations. We preferred manifest correlations over latent ones in order to remain consistent (some correlates, such as age and gender, do not have measurement errors) and to be able to compare the single effect sizes with each other. Therefore, the reported values probably represent the lower bound of the true associations. The correlation coefficients are depicted in Table 6; their interpretation is based on Cohen (1992): small effect (r ≥ .10), medium effect (r ≥ .30), and strong effect (r ≥ .50). Due to alpha accumulation through multiple testing, only coefficients with a significance level above p < .001 are interpreted (Table 6 displays unadjusted p values).
In order to investigate both types of construct and criterion validity, we correlated the KSA-3 and the three subscales with the following constructs and criteria: (a) the Big Five dimensions Extraversion, Agreeableness, Conscientiousness, Emotional Stability, and Openness assessed with the BFI-2-XS (Rammstedt et al., 2020; Soto & John, 2017); (b) political preferences assessed with the Left-Right Self-Placement scale (Breyer, 2015); (c) internal political efficacy (individual's belief of having political means of influence; Balch, 1974) and external political efficacy (individual's belief that the government responds to influence attempts; Balch, 1974) assessed with PEKS (Beierlein et al., 2014; Groskurth et al., 2019); and (d) two aspects of socially desirable responding (exaggerating positive qualities and minimizing negative qualities) assessed with the KSE-G (Kemper et al., 2014a; Nießen et al., 2019).
Construct validity
With regard to personality in terms of the Big Five dimensions, previous research suggests the strongest negative associations of authoritarianism with Openness (e.g., Akrami & Ekehammar, 2006; Heaven & Bucci, 2001; Hodson & Sorrentino, 1999; Nicol & De France, 2016; Perry & Sibley, 2012; Sibley & Duckitt, 2008). In addition to the aforementioned association, positive associations with a second Big Five dimension, namely Conscientiousness, have been reported (e.g., Heaven & Bucci, 2001; Hodson & Sorrentino, 1999; Nicol & De France, 2016; Sibley & Duckitt, 2008). In the present analyses, we could replicate these differing findings, because we also found these different patterns across the two countries. For the UK sample, there were small negative associations between authoritarianism, aggression, conventionalism and Openness, which is in line with, for instance, Akrami and Ekehammar (2006) and Perry and Sibley (2012), whereas there was a small negative association between authoritarianism, conventionalism and Openness and a small positive association between aggression and Conscientiousness in the German sample, which is in line with, for instance, Heaven and Bucci (2001), Hodson and Sorrentino (1999), Nicol and de De France (2016), and Sibley and Duckitt (2008). Stable across the two countries, there were no associations with Extraversion, Agreeableness, and Emotional Stability.
With regard to political orientation, we could replicate the findings of the German-language source version. Consistent with previous findings (e.g., Duckitt et al., 2010; Meloen, Van der Linden, & De Witte, 1996), including those of Beierlein et al. (2015), we found for Germany stable small-to-medium positive relations with the left-right self-placement for authoritarianism and all subdimensions, the highest for the subdimension aggression, and for the UK medium positive relations of similar sizes with authoritarianism and all subdimension. Individuals high in political conservatism had a higher propensity for authoritarianism.
Concerning political efficacy, stable across the two countries, and for all (sub-)dimensions, there were zero or no reportable effects for internal political efficacy (see also Lane, 1955; note that Lane did not differentiate between internal and external political efficacy). In contrast, we found small-to-medium positive effects for all (sub-)dimensions with external political efficacy in the UK sample (see also Meloen et al., 1996), the highest for submissiveness, but only a medium positive effect for submissiveness in the German sample. Individuals high in external political efficacy had a higher tendency to have authoritarian(-submissive) attitudes.
In line with previous research (e.g., Christopher, Zabel, Jones, & Marek, 2008; Duckitt, 1993; Ekehammar et al., 2004; Rowatt & Franklin, 2004), there were zero or no reportable correlations between the higher-order factor, aggression, conventionalism and socially desirable responding in the German samples (submissiveness was the exception, which was positive related with "minimizing negative qualities"), whereas in the UK sample there were small-to-medium effects for authoritarianism and all subscales (see also Taylor, 1961), but only for the "minimizing negative qualities" subscale (see also Tsang & Rowatt, 2007), which depicts the impression-management component of communion-induced socially desirable responding (Nießen et al., 2019).
In sum, some clear similarities but also some major differences among both countries should be highlighted. First, for both countries and all (sub-)dimensions, there was consistently a positive relation to politically conservative orientation. Second, all found associations with the subdimension submissiveness were the same among both countries. Third, the Big Five dimension Openness to Experience had comparably negative correlations with two to three (sub-)dimenions. But fourth, relations to external political efficacy and the subscale "minimizing negative qualities" of socially desirable responding proved to be completely different: For both constructs, in the UK, there was as positive correlation for all (sub-)dimensions, whereas in Germany, we found only a positive correlation with subdimension submissiveness. However, the pattern of correlations confirms the construct validity of the KSA-3.
Correlations with sociodemographic variables
Furthermore, we calculated correlations between the KSA-3 and relevant sociodemographic variables, namely employment status, income, educational level, age, and gender. Little evidence exists to date on sociodemographic and socioeconomic correlates of authoritarianism. In the present analyses, we found only correlations with educational level, namely small negative ones between the subdimensions conventionalism, aggression (DE only), authoritarianism (DE only) and educational level. Individuals with a high educational level had a lower propensity for conventional or aggressive attitudes and authoritarianism in general. This finding is in line with evidence from Beierlein et al. (2015), Christopher et al. (2008), Duriez and Van Hiel (2002), Lederer and Schmidt (1995), Meloen et al. (1996), and Schmidt and Heyder (2000) that the tendency to authoritarian attitudes decreases with increasing educational level. For both countries, there were no associations between employment status, income, age (unlike Beierlein et al., 2015; Christopher et al., 2008; Duriez & Van Hiel, 2002; Lederer & Schmidt, 1995; Schmidt & Heyder, 2000), gender (see also Beierlein et al., 2015; Christopher et al., 2008; Lederer & Schmidt, 1995; Nicol & De France, 2016; but unlike Meloen et al., 1996) and authoritarianism.
Table 6
Correlations of the KSA-3 with Relevant Variables
Note. UK = United Kingdom (N = 468; NLeft-right self-placement = 325; NEmployment status = 450; NIncome = 431); DE = Germany (N = 474; NLeft-right self-placement = 394; NEmployment status = 462; NIncome = 449); CI = confidence interval; PQ+ = exaggerating positive qualities; NQ− = minimizing negative qualities. Gender: 1 = male, 2 = female.
*p < .05, **p < .01, ***p < .001. Coefficients significant on the < .001 level are in bold type.
Descriptive statistics
Table 7 provides the reference ranges in terms of means, standard deviations, skewness, and kurtosis of the KSA-3 scale scores for the total population, as well as separately for gender and age groups in both states. Standard values are not available.
Table 7
Reference Ranges of the KSA-3 Scale Scores for the Total Population and Separately for Gender and Age Groups
|
|
M |
SD |
Skewness |
Kurtosis |
||||
|
|
UK |
DE |
UK |
DE |
UK |
DE |
UK |
DE |
|
Authoritarianism |
2.86 |
2.93 |
0.82 |
0.77 |
0.19 |
−0.01 |
−0.14 |
−0.10 |
|
Aggression |
3.24 |
3.29 |
0.95 |
0.89 |
−0.04 |
−0.18 |
−0.50 |
−0.38 |
|
Submissiveness |
2.31 |
2.53 |
1.03 |
0.99 |
0.62 |
0.24 |
−0.10 |
−0.49 |
|
Conventionalism |
3.02 |
2.98 |
0.93 |
0.93 |
−0.04 |
−0.12 |
−0.39 |
−0.31 |
|
Authoritarianism |
|
|
|
|
|
|
|
|
|
Male [nUK = 222; nDE = 237] |
2.79 |
2.91 |
0.83 |
0.78 |
0.03 |
0.05 |
−0.57 |
−0.18 |
|
Female [nUK = 246; nDE = 237] |
2.92 |
2.95 |
0.82 |
0.76 |
0.35 |
−0.06 |
0.14 |
−0.04 |
|
Aggression |
|
|
|
|
|
|
|
|
|
Male [nUK = 222; nDE = 237] |
3.15 |
3.23 |
0.96 |
0.89 |
−0.09 |
−0.21 |
−0.66 |
−0.42 |
|
Female [nUK = 246; nDE = 237] |
3.32 |
3.34 |
0.93 |
0.89 |
0.03 |
−0.15 |
−0.43 |
−0.38 |
|
Submissiveness |
|
|
|
|
|
|
|
|
|
Male [nUK = 222; nDE = 237] |
2.32 |
2.51 |
1.07 |
1.04 |
0.53 |
0.38 |
−0.42 |
−0.56 |
|
Female [nUK = 246; nDE = 237] |
2.31 |
2.55 |
0.98 |
0.95 |
0.71 |
0.08 |
0.23 |
0.43 |
|
Conventionalism |
|
|
|
|
|
|
|
|
|
Male [nUK = 222; nDE = 237] |
2.91 |
2.99 |
0.93 |
0.95 |
−0.18 |
−0.14 |
−0.63 |
−0.25 |
|
Female [nUK = 246; nDE = 237] |
3.12 |
2.97 |
0.92 |
0.92 |
0.10 |
−0.09 |
−0.34 |
−0.41 |
|
Authoritarianism |
|
|
|
|
|
|
|
|
|
18−29 [nUK = 104; nDE = 105] |
2.79 |
2.93 |
0.86 |
0.81 |
0.16 |
0.21 |
−0.17 |
0.03 |
|
30−49 [nUK = 180; nDE = 191] |
2.92 |
2.94 |
0.84 |
0.73 |
0.10 |
−0.13 |
−0.31 |
−0.11 |
|
50−69 [nUK = 184; nDE = 178] |
2.84 |
2.93 |
0.79 |
0.78 |
0.33 |
−0.04 |
0.01 |
−0.31 |
|
Aggression |
|
|
|
|
|
|
|
|
|
18−29 [nUK = 104; nDE = 105] |
3.15 |
3.25 |
0.98 |
0.86 |
0.00 |
−0.22 |
−0.41 |
−0.08 |
|
30−49 [nUK = 180; nDE = 191] |
3.29 |
3.28 |
0.92 |
0.91 |
−0.07 |
−0.23 |
−0.36 |
−0.49 |
|
50−69 [nUK = 184; nDE = 178] |
3.24 |
3.32 |
0.96 |
0.90 |
−0.02 |
−0.11 |
−0.74 |
−0.48 |
|
Submissiveness |
|
|
|
|
|
|
|
|
|
18−29 [nUK = 104; nDE = 105] |
2.26 |
2.62 |
1.10 |
1.02 |
0.70 |
0.19 |
−0.22 |
−0.51 |
|
30−49 [nUK = 180; nDE = 191] |
2.46 |
2.56 |
1.05 |
0.94 |
0.50 |
0.16 |
−0.38 |
−0.54 |
|
50−69 [nUK = 184; nDE = 178] |
2.20 |
2.44 |
0.94 |
1.02 |
0.64 |
0.37 |
0.22 |
−0.47 |
|
Conventionalism |
|
|
|
|
|
|
|
|
|
18−29 [nUK = 104; nDE = 105] |
2.95 |
2.92 |
0.98 |
0.96 |
−0.02 |
0.04 |
−0.57 |
−0.15 |
|
30−49 [nUK = 180; nDE = 191] |
3.02 |
2.98 |
0.90 |
0.90 |
−0.10 |
−0.16 |
−0.31 |
−0.32 |
|
50−69 [nUK = 184; nDE = 178] |
3.07 |
3.03 |
0.93 |
0.95 |
0.02 |
−0.17 |
−0.44 |
−0.46 |
Note. UK = United Kingdom (N = 468); DE = Germany (N = 474).
Further quality criteria
Due to its short completion time (< 1 min), the instrument can be seen as economic.
We assessed international equivalence across the UK and Germany via measurement invariance tests with MG-CFA (Vandenberg & Lance, 2000; Widaman & Reise, 1997). In order to determine the level of measurement invariance, we used the cut-off values recommended by Chen (2007). According to these benchmarks, SRMR as well as MLR-scaled CFI and RMSEA indicate that metric measurement invariance of the KSA-3 holds across the UK and Germany, implying comparability of correlations based on the latent factors between both countries (configural model: CFI = .959, RMSEA = .074, SRMR = .042; metric model: CFI = .956, RMSEA = .071, SRMR = .051; scalar model: CFI = .923, RMSEA = .090, SRMR = .061).[4] Full scalar invariance does not hold, but partial scalar invariance holds by setting the intercept of item 1, 4, and 8 (see Table 1) free (CFI = .947, RMSEA = .077, SRMR = .054),[5] which implies that latent means can be directly compared.
Acknowledgement
We would like to thank Melanie Partsch (GESIS - Leibniz Institute for the Social Science) for preparing the data.
[4] Robust CFI and robust RMSEA are as follows: configural model - robust CFI = .962, robust RMSEA = .081; metric model - robust CFI = .960, robust RMSEA = .077; scalar model - robust CFI = .930, robust RMSEA = .097.
[5] Robust CFI = .951, robust RMSEA = .083.
Nießen, D., Schmidt, I., Beierlein, C., & Lechner, C. M.